Origin supports four legend objects and two scale objects. This page focuses on legend objects. For information on scale objects, see Color Scales and Bubble Scales.
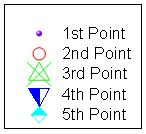
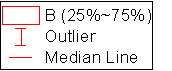
| The Data Plot Legend | The Categorical Values Legend | The Point-by-Point Legend | Box Chart Components Legend |
|---|---|---|---|
|
|
|
|
|
The four graph legends above share the following components:
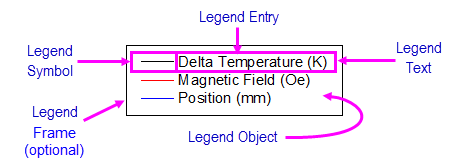
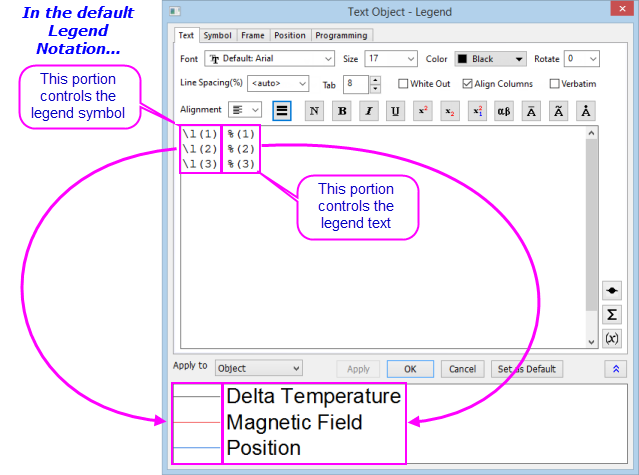
The graph legend is a special text object that is automatically created on the graph page. The legend object is given a specific name -- "Legend" -- and programmatically linked to your Origin project data using LabTalk notation. You will not see this notation unless you are editing the legend object. Normally, what displays is the "translated" symbol and legend text.
This image of a typical legend's Object Properties dialog box shows the LabTalk notation in the center of the dialog and the "translated" legend symbol and legend text -- what you actually see on the graph page -- in the lower part of the dialog.
It is generally preferable to use plot-associated metadata in combination with dialog box settings, to create the legend symbol and text. For information on how to set that up, see:
However, you are not limited to programmed legends. At times, a manual edit of the legend object is the quickest way to get the job done. Since the legend is a text object, you can edit it using methods common to all text objects:
Double-clicking on the graph legend symbol opens the Plot Details dialog box. Presing Ctrl + double-clicking on the graph legend text opens the Legend dialog box. |
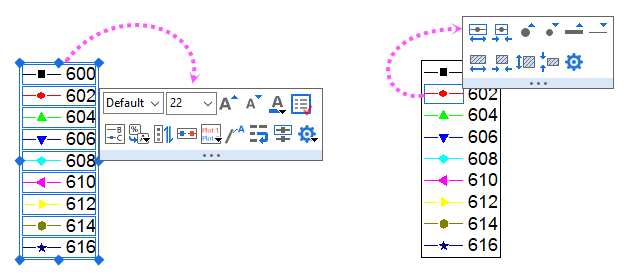
There are Mini Toolbars dedicated to legend customization. Available buttons will vary by plot/legend type.
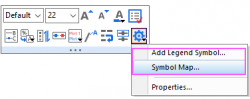
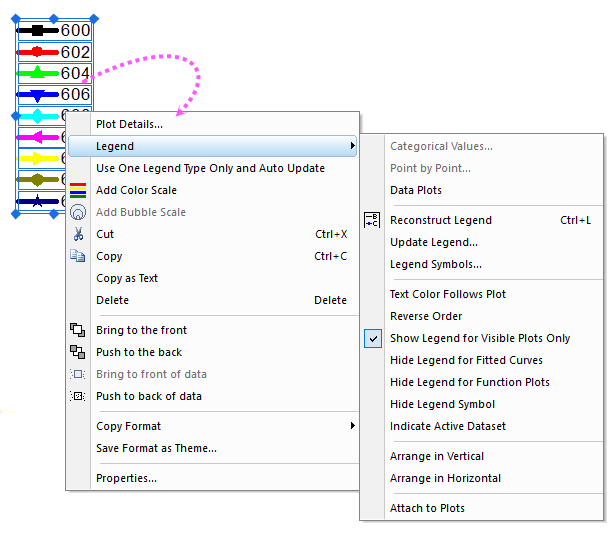
And, you also can right-click on the legend to expand the short-cut menu to customize the legend:
| To do | Using Mini Toolbar | Using Other Controls | ||
|---|---|---|---|---|
| To delete the entire legend object | Delete key, or Delete shortcut menu. | |||
| To add background to the legend box: | Fill Color button | |||
| To show or hide the frame of legend box: | Frame button |
|||
| To modify thickness or color of the frame line | Line/Border Color button  on the Style toolbar on the Style toolbar
| |||
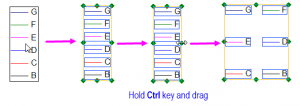
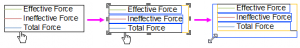
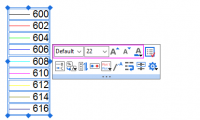
| To resize the legend | Select the legend object, then drag one of the selection handles. | |||
| To arrange the legend entries | Arrange in Horizontal |
| ||
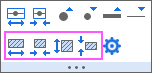
| To adjust padding between legend entries and the background | Point to outside edge of the legend object and when the pointer becomes a "hand", click once to show handles. Drag a handle to add or subtract padding.
| |||
| To increase the legend symbol width | Larger Symbol Width button |
Legend Symbol Width (% of Font) in Legends/Titles tab of Plot Details. | ||
| To change the line spacing between legend entries | Line Spacing (%) list in Text tab of Text Object - Legend dialog. | |||
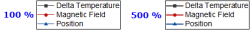
| To adjust the symbol size | Increase Scatter Symbol Size button |
Click the Symbol tab and set Scatter Symbol Size in Text Object - Legend dialog.
| ||
| To modify the legend symbol line width | Increase Line Thickness button |
Click the Symbol tab and set Line Thickness in Text Object - Legend dialog.
| ||
| To modify format of the legend text | Set Font, Font Size, Increase Font Size , Decrease Font Size and Font Color button
|
Format toolbar.
| ||
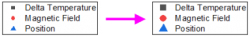
| To make the legend text color follow the symbol color | Set Font Color button |
| ||
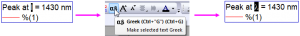
| To add special characters (symbols, Greek characters, etc.) to the legend | Click More button |
| ||
| To reorder legend entries | Reverse button |
| ||
| To update the legend object after adding or removing plots/special points | Reconstruct Legend button |
| ||
| To construct a single legend for multiple layers | Legend: Update Legend short-cut menu. In the legendupdate dialog box, set Update Scope to Whole Page; Update Mode to Reconstruct; and Legend to One Legend for Whole Page. | |||
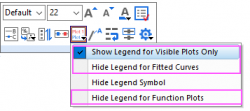
| To show or hide certain legend entries | Click Show/Hide button |
Legend:Show Legend for Visible Plots Only, Legend: Hide Legend for Fitted Curves or Legend: Hide Legend for Fucntion Plots short-cut menu | ||
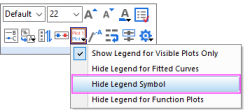
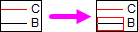
| To hide legend symbol(s) | Click Show/Hide button |
Legend: Hide Legend Symbol short-cut menu | ||
| To show the active dataset indicator | Indicate Active Dataset button |
| ||
| To attach the legend texts to plots | Attach to Plots button |
Legend: Attach to Plots short-cut menu
Note:
| ||
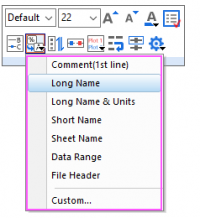
| To change the legend text to other variable of the plot(such as the column label rows) | Data Plot Legend Translation Mode button
|
Translation Mode of %(1),%(2) control in in Legends/Titles tab of Plot Details. | ||
| To wrap the legend text | Wrap Text button |
Go to Frame tab of Text Object - Legend dialog, check Wrap Text, Adjust Height.
If you are manually editing legend text and you need to wrap a long string, see the \ww(literal text) escape sequence. Also, see use of "%(CRLF)" to hard-code a line break (next). | ||
| To change legend symbol block height/width | Pattern Block buttons
|
Legend Symbol Block Width and Legend Symbol Block Height drop-down list in Symbol tab of Text Object - Legend dialog | ||
| To use "dumbbell-shaped" symbols in Line + Symbol legends | Symbol+Line Style drop-down list in Symbol tab of Text Object - Legend dialog
| |||
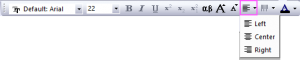
| To align the legend text |
| |||
| To reconstruct legend to show only one legend type, and update legend automatically | Right-click on the legend, select Use One Legend Type Only and Auto Update | |||
| To remove repeated legend entries when you used one column label row to control plot color | Reconstruct Legend button |
Right-click on the legend, select Legend: Reconstruct Legend |
 .
.
The four types of legend objects can co-exist in one graph. For example, you may have multiple Y datasets and plot them as a box chart. However, you would like to show both the data plot legend and the box chart component legend.
|
Topics covered in this section: |