 .
.A categorical values legend can be added to any graph that meets the following requirements:
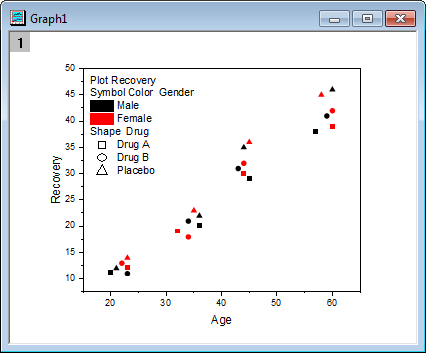
In this example, researchers studied Recovery Time (Y axis) versus Age of Patient (X axis) while looking at the interactions of two additional variables: gender (Male or Female) and treatment (Drug A, Drug B or Placebo). Gender and treatment data provide the indexing variables for symbol color and symbol shape, respectively. The plot and the accompanying categorical legend for this study would look something like this:
.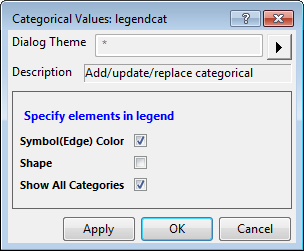
Note: The legendcat dialog box uses the legendcat X-Function.
| Plot Attribute |
If one plot attribute has included color-indexing or size/shape/interior/fill pattern indexing, a check box of this plot attribute will be shown and such check box can be used to determine whether to add this plot attribute as a categorical entry.
Up to 13 plot attributes could be shown here, they are: Symbol(Edge) Color, Fill Color, Pattern Color, Fill Pattern, Shape, Interior, Size, Line Color, Line Style, Line Width,Vector Color(vector plot), Vector Line Style(vector plot) and Distribution Fill(box chart).
| |
|---|---|---|
| Show All Categories |
This is only useful when user defined categories are added to the indexing column in the (Column Properties) Categories tab. When this is checked, the manually added categories will also show in the legend. Otherwise, only the categories that exist in indexing column will show in the legend. |
Note: There is legend title for each category to indicate what plot attribute is mapped to which data. However, in the following two cases, title is not needed and thus is automatically hidden:
|
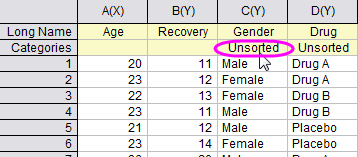
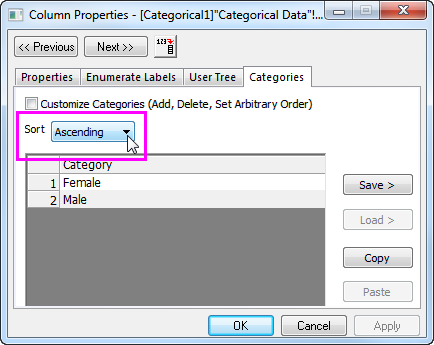
The order of entries in a categorical values legend follows the order of first appearance in the categorical values data column. By default, when a column is set as Categorical, the values are unsorted (you will see Unsorted in the column's Categories label row). If you would like to put the values in alphabetical order (ascending or descending):