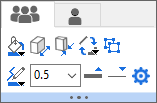
28.4 Mini Toolbar
Mini-Toolbar
By default, Mini Toolbars will appear when you select an object or click in certain key areas inside the page.
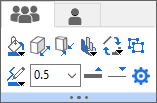
To hide the Mini Toolbars, you can uncheck the View:Mini Toolbars menu.
Press Shift after the Mini Toolbar has faded away to make it re-appear.
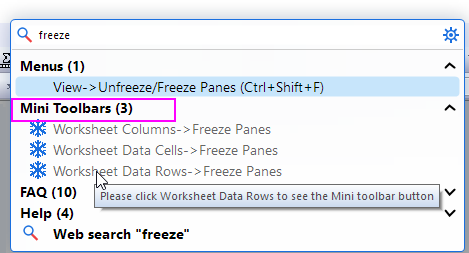
To find the exact button in the Mini Toolbar, you can use the Search tool  in the main menu.
For example: If you want to use the Mini Toolbar button to freeze the rows in Worksheet, enter the key word freeze in the Search tool. Then you will find it lists all the related button under Mini Toolbars section. When the mouse hover on one of them, it will shows the detail hint of this button.
 | When you click the item in the Object Manager, it also will show the corresponding Mini Toolbars of the object.
|
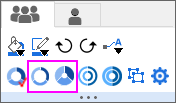
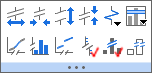
Plots Type
For the Group plot, you can custom the plots properties togethter by the buttons under the Group tab. 

|
Ungroup
|
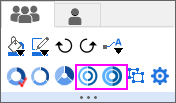
Also, you can custom one plot properties by the buttons under the Single tab. 
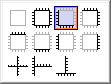
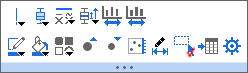
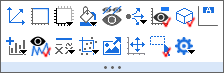
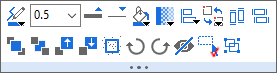
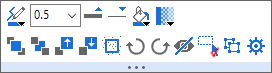
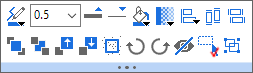
Scatter Plot
Single Data Point
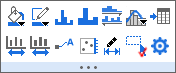
Line Plot
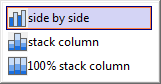
Column Plot
Single column

Area Plot
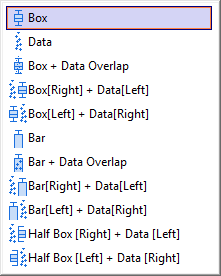
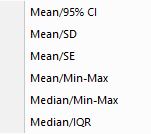
Box Plot
Data Type for Box Plot:
Interval Plot:
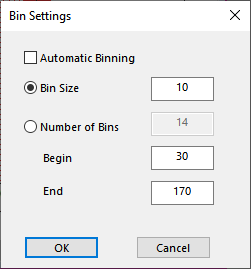
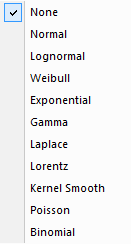
Histogram
Dot Plot
Grouped/Stacked Dot Plots
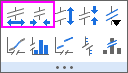
| Group tab
|
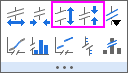
Single tab
|
|
|
|
|

|
Symbol edge color.
|

|
Symbol filled color.
|

|
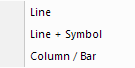
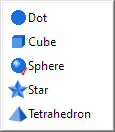
Change symbol shape from drop-down list.
|
|
|

|
Increase symbol size, which will change bin size/number accordingly.
|

|
Decrease symbol size, which will change bin size/number accordingly.
|

|
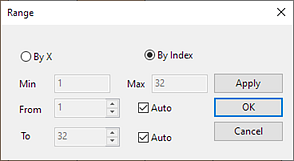
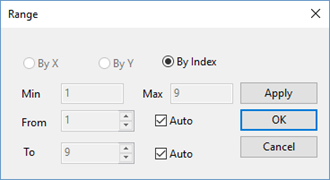
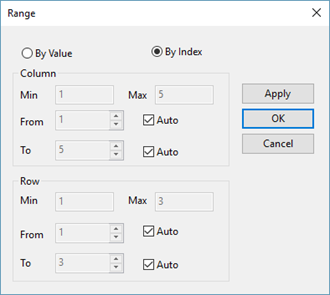
Edit range
|

|
Click to make current plot unselectable.
|

|
Go to the source worksheet.
|

|
Open Plot Details dialog.
|
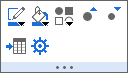
Pie Plot

2D & 3D Vector Plot
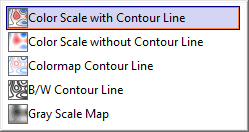
Contour & Heatmap
Contour:
Heatmap:
Heatmap with Split Tiles
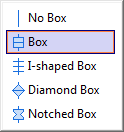
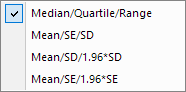
Error Bar
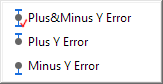
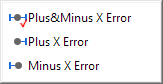
2D Error Bar:
3D Error Bar:
3D Scatter Plot
Single Data Point
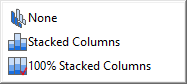
3D Bar Plot
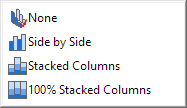
XYY 3D Bar Plot
One plot in the graph:
Single Bar
Multiple plots in the graph:
|
|
3D Ribbon & 3D Wall
One plot in the 3D Ribbon & Wall graph:
Multiple plots in 3D Ribbon graph:
|
Multiple plots in 3D Wall graph:
|
3D Surface
Axis
Axis
Axis Tick Labels
Axis Title
Axis Break
Reference Lines
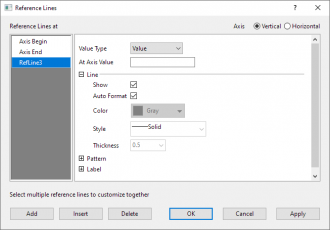
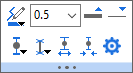
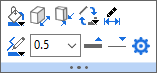
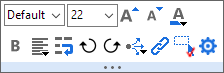
Clicking on the reference Lines will bring up the following mini toolbar for customization:
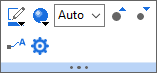
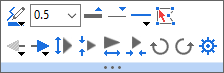
Reference Lines
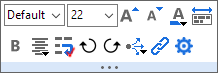
Especially, if the reference line is a fitted curve/trend line (which can be added to scatter or line plot by Fitted Curves button  or Trend Line button
  ), selecting the line will pop-up the following mini toolbar:
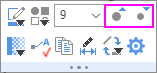
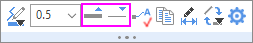
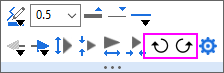
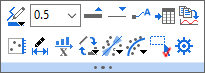
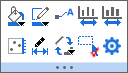
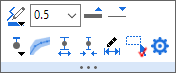
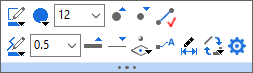
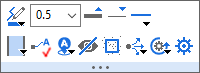
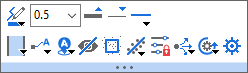
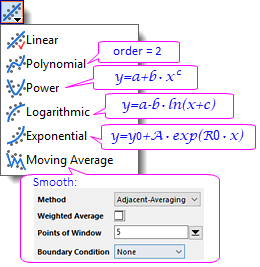
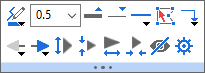
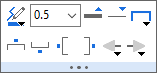
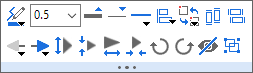
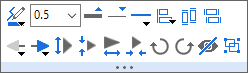
Fitted Curves/Trend Line

|
Specify line color.
|

|
Select or type in line thickness in pt.
|

|
Increase line thickness
|

|
Decrease line thickness
|

|
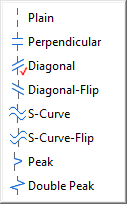
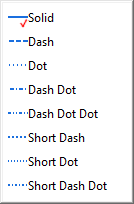
Specify line style.
|

|
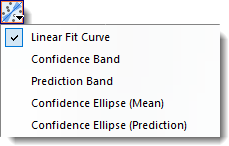
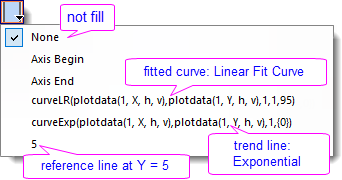
Specify whether to fill color to area between the current line and the selected reference line. If yes, you can select from the drop-down list the desired reference line to which the color is filled.
Note that fitted curves, trend lines, other reference lines added from the Axis dialog, and begin and end axes will be listed in the drop-down.
|

|
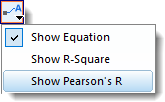
Show Labels
Add label of reference value. For fitted curves and trend lines (available when Trend Type is not set to Moving Average), you can choose to show the fitted equation/trend line equation and/or R-Square value. For linear fitted curves (when Trend Type is set to Linear), you can also show the Pearson's R..
- The label is added to the end of the line by default. You can use Label Position button
 to change the position. to change the position.
- You can select the labels and customize the labels by using the popped-up Mini Toolbar.
|
|
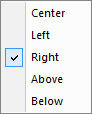
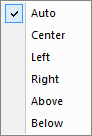
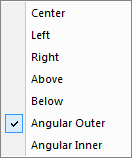
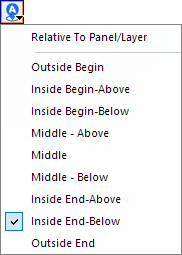
Label Position
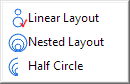
Once a label is added, choose from the drop-down list to specify the label position or relative the label to Panel/Layer.
|

|
Hide selected fitted curve/trend line.
Notes:
Once a fitted curve/trend line is hidden, it cannot be brought back. You will need to select the scatter/line plot and add the fitted curve/trend line again.
|

|
Click this button to push the selected reference line back to the data plot.
|

|
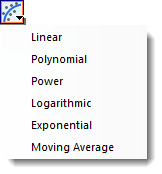
Available for fitted curves and trend lines. Change the trend type.
|

|
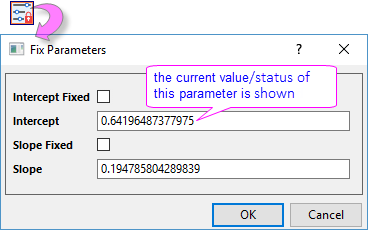
Clicking this button will pop up the Fix Parameters dialog to specify which parameter(s) to be fixed and the value to fix to.
|

|
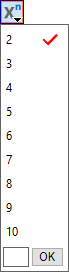
Available when Trend Type is set to Polynomial. Specify order value from 2 to 10, or enter the order number in the last edit box.
|

|
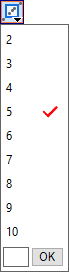
Available when Trend Type is set to Moving Average. Specify the number of points in a moving window. Value from 2 to 10, and you can manually enter the number in the last edit box.
|

|
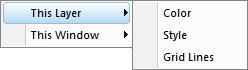
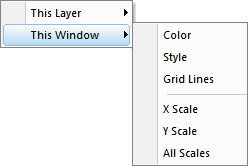
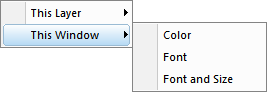
Apply format settings of the current reference line to reference lines in the active layer or window.
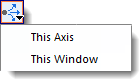
|

|
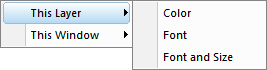
Set current formattings of selected reference line as default for other reference lines created later.
|

|
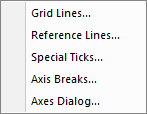
Open the Reference Lines dialog.
|
|
|
If you choose Fill to button to fill color between reference lines, clicking on the fill color will bring up following mini toolbar for customization.
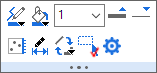
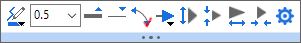
The color filled between reference lines


|
Fill Color.
|

|
Drag the slider to change the transparency.
|

|
Show Line for Begin
|

|
Show Line for End
|

|
Push filled color in front of the data plot.
|
|
Open the Reference Lines dialog.
|
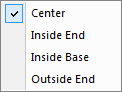
Data Label
Graph Layer
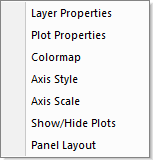
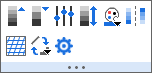
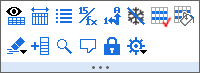
Click the space area within the layer frame to pop up the mini toolbar for graph layer:
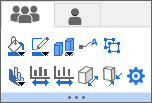
2D Layer
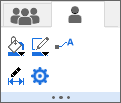
When multiple layers are selected:
3D Layer
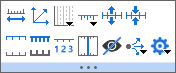
Graph Page
Move the cursor to the page edge, click the edge or gray area outside the graph page when the cursor turns to  . The mini toolbar below will appear:
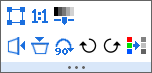
2D (one layer in a graph)
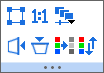
2D (multiple layers in a graph)
3D
Layout Page
Move the cursor to the page edge, click the edge or gray area outside the page when the cursor turns to . The mini toolbar below will appear:
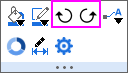
Object
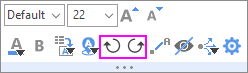
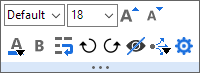
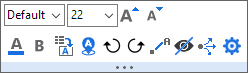
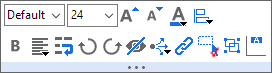
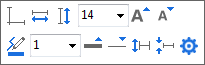
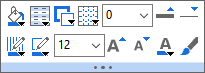
Text Object
Including: Text, Annotation
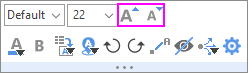
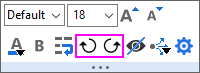
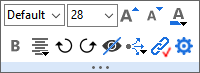
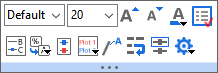
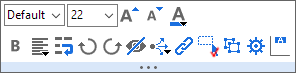
Graph Page/ Layer Title
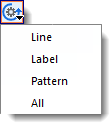
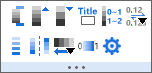
Legend
Legend Symbol

|
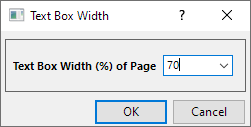
Larger Symbol Width
|

|
Smaller Symbol Width
|
|
|
Increase Scatter Symbol Size
|
|
Decrease Scatter Symbol Size
|
|
|
Increase Line Thickness
|
|
Decrease Line Thickness
|

|
Larger Pattern Block Width
|

|
Smaller Pattern Block Width
|

|
Larger Pattern Block Height
|

|
Smaller Pattern Block Height
|
|
|
Open Properties Dialog
|
Color Scale
Bubble Scale
Draw Object
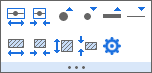
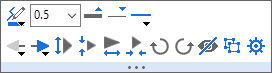
Line/ Arrow / Curve Arrow / Elbow Arrow / Angle Annotation
Other Draw Object
Including: Polyline, Curve, Freehand Draw, Rectangle, Circle, Polygon and Region object.
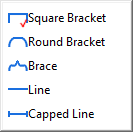
Asterisk Bracket
Asterisk brackets added by the Add Object to Graph toolbar, can be edited using the Mini toolbar buttons.
Click on the bracket, the Mini toolbar below will show:
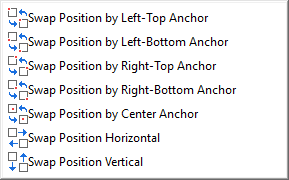
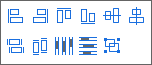
Multiple Objects
When select multiple Text or Draw objects, you can use this Mini Toolbar to these objects. If the selected objects are the same type, they can be changed the setting in sync by Mini Toolbar.
|
|
Ungroup
|
Group
|
| Select Text and Draw objects
|
|
|
| Select two Text objects
|
|
|
| Select three or more Text objects
|
|
| Select two Draw objects (lines)
|
|
|
| Select three or more Draw objects (lines)
|
|
| Select two Draw objects
|
|
|
| Select three or more Draw objects
|
|
Besides the basic buttons for Text Object or Draw Object, there are two specific buttons:
XY Scaler
Axis Scrollbar


|
Zoom In Axis Range
|

|
Zoom Out Axis Range
|

|
Zoom In Scroll Range
|

|
Zoom Out Scroll Range
|

|
Reset
|
|
Open Properties Dialog
|
Data selector/ Regional Data Selector


|
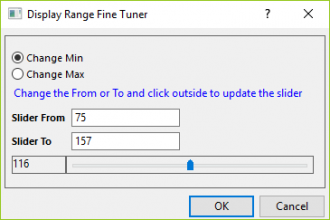
Set Display Range
|

|
Remove Selector
|

|
Copy Data for All Selectors
|

|
Copy Data
|

|
Delete Data
|
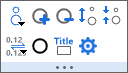
Analysis Marker


|
Marker Size
|
|
|
Table
Selection Region to Zoom
When the cursor is on Pointer mode  , select a rectangle region (red border) inside a graph layer, then this Mini Toolbar will show.

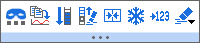
WorkSheet
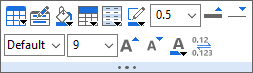
Worksheet
Go to the last column in current worksheet, move the cursor to the edge of the worksheet, click the gray area when the cursor turns to . The mini toolbar below will appear:
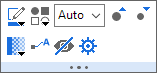
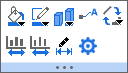
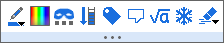
Single Column
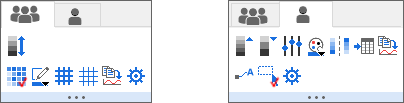
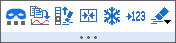
Click the column header to select the column. The mini toolbar below will appear:
| Text
|
Text & Numeric / Numeric
|
|
|
| Date
|
Time
|
|
|
| Color
|
|
|
|
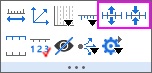
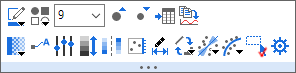
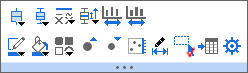
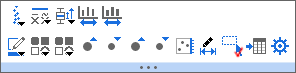
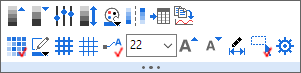
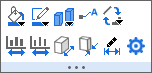
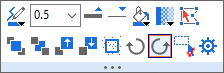
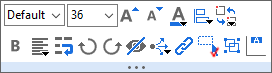
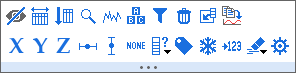
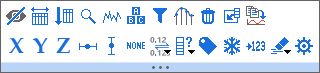
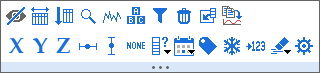
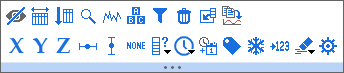
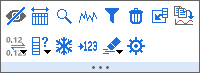
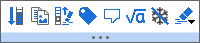
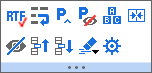
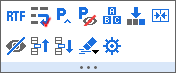
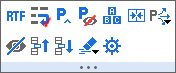
Multiple Columns
Press the left key of mouse to select the first column and drag-and-drop to select multiple columns. The mini toolbar below will appear:

|
Hide Columns
|

|
Resize to Show All
|

|
Find
|

|
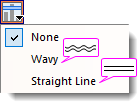
Add Sparkling
|

|
Add data filter
|

|
Delete selected columns
|

|
Insert the number of columns selected before the first selected column
|

|
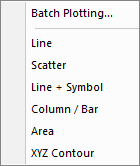
Copy for Plotting
|

|
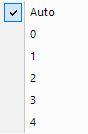
Select from the dorp-down list to set the number of digits for numeric display
|

|
Set columns' format from the drop-down list
|

|
Freeze the selected columns
|

|
Convert cell formula to value
|

|
Clear contents/formats/notes of the selected columns
|
|
Open the Column Properties dialog
|
Single Row
Click the row header to select the row. The mini toolbar below will appear:
Multiple Rows
Press the left key of mouse to select the first row and drag-and-drop down to select multiple rows. The mini toolbar below will appear:
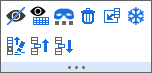
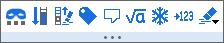
Single Cell
Click on the single cell with value. The mini toolbar below will appear:
Cell contains data
Cell contains image
Cell in Color Column
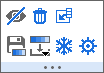
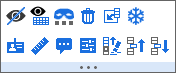
Multiple Cells /Range
Highlight multiple cells in a column:
Highlight multiple cells in mutiple columns:

|
Mask/ Unmask Data
|
|
Copy for Plotting
|

|
Extend Selection to last row with data
|

|
Clear rows before selected cell. Available when the selected cell is not in the first row.
|

|
Dynamically merge selected cells
|
|
|
|
|
Freeze Panes
|

|
Unfreeze panes
|
|
|
Convert cell formula or cell link to plane value
|

|
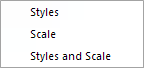
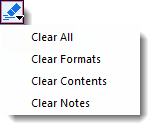
Select from sub-menu to clear formats (bold, fill color, etc.), contents, inserted notes, or all above in the worksheet.

|
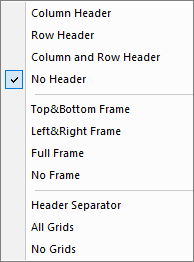
Label Row
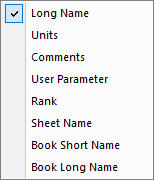
When a column label row is selected:
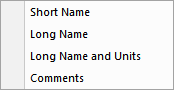
When label row = Long Name is selected:
When a user-defined parameter row is selected:
Worksheet inserted in Layout
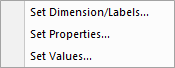
Matrix
Click on the left-top corner of the matrix to select the whole matrix object. The mini toolbar below will appear:
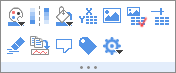
Image Page
Move the cursor to the page edge, click the edge or gray area outside the image page when the cursor turns to . The mini toolbar below will appear:
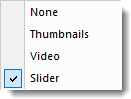
Single frame Image
Video

Multi-frame stacked Image
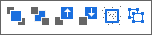
Data Highlighter
When open Data Highlighter, this Mini Toolbar will show in the right-top conner of the Graph window or Workbook window.


|
Create Subset Sheet
|

|
Create Categories
|

|
Mask/Unmask Highlight Points
|

|
Mask/Unmask Dimmed Points
|

|
Delete Points
|
|
Open Properties Dialog
|
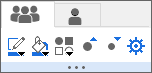
Project Explorer
Click the folders name in the Project Explorer to pop up this mini toolbar:


|
Folder Notes
|

|
Duplicate Folder
|
|
|
Open Folder Properties Dialog
|
|
|
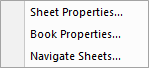
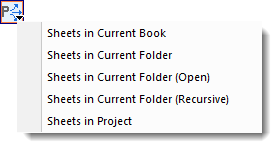
Report Sheet
Move the cursor to the edge of the report sheet, click the edge or blank area outside the report sheet when the cursor turns to . The mini toolbar below will appear:


|
Send All Open Branches to Word
|

|
Send All Graphs to PowerPoint
|
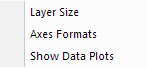
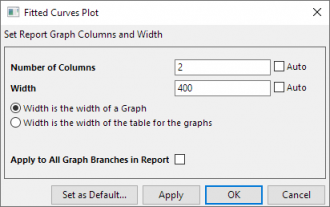
Graph in the Report Sheet
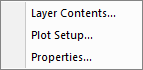
Click the graph in the report sheet to pop up this mini toolbar:
Buttons that Increment
Some Mini Toolbar buttons increase or decrease some property by some increment each time you click the button (e.g. font size of text). Control incrementing using the following LabTalk system variables:
You can check the increment value of a particular button by hovering on it. The Status Bar reports the current increment and the LabTalk system variable that you can modify to change the increment.

For information on changing the value of a LabTalk system variable see FAQ-708 How do I permanently change the value of a system variable?.