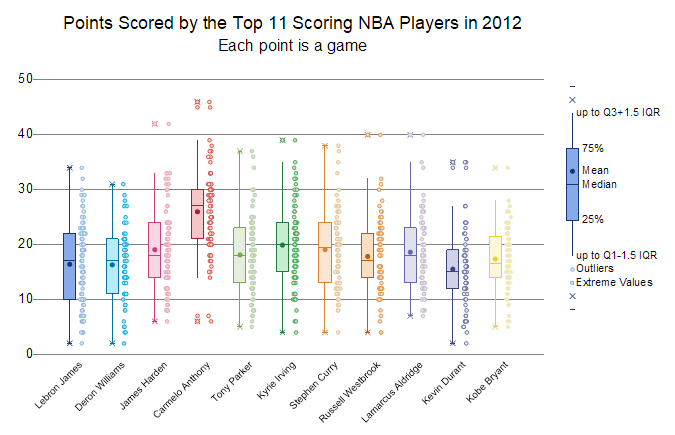
From Origin 2023, it is supported to add a box scale object to the Box graph.
In the Box plot, box scale could be added in any of the following ways:
This dialog is used to control and customize the style of the box scale.
To open the Box Scale Control' dialog:
or
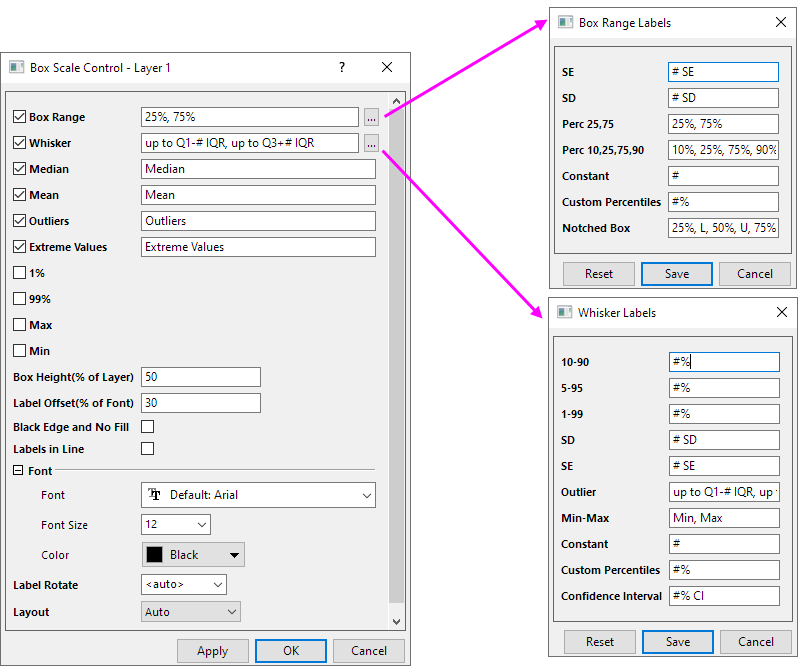
In the box scale, it shows Box Range, Whisker and Median by default. And the displaying of other symbols that depends on they whether selected in the Plot Details dialog.
And label of these components whether to show that can be controlled in this dialog. Except Box Range, Whisker and Median, if the symbol is not selected in the Plot Details dialog, the label option also will not show in this dialog.
| Box Range | Show and customize the labels for the box range.
Clicking the For example: If the box range is set to SE, the label will show the text in the SE edit-box. Reset button can help to roll back the label to default setting. |
|---|---|
| Whisker | Show and customize the labels for the whisker of the box.
Clicking the For example: If the whisker is set to Constant, the label will show the text in the Constant edit-box. Reset button can help to roll back the label to default setting. |
| Median | Show and customize the labels for the median symbol of the box.
The median symbol is controlled in the Percentile Tab of Plot Details dialog |
| Mean | Show and customize the labels for mean symbol of the box.
The mean symbol is controlled in the Percentile Tab of Plot Details dialog |
| Outliners | Show and customize the labels for outliners of the box.
The outliners is controlled in the Outliers Tab of Plot Details dialog |
| Extreme Values | Show and customize the labels for extreme values of the box.
The extreme values symbol is controlled in the Outliers Tab of Plot Details dialog |
| 1% / 99% / Max / Min | Show and customize the labels for 1% / 99% / Max / Min of the box.
These symbols are controlled in the Percentile Tab of Plot Details dialog |
| Box Height
(% of Layer) |
Specify the height of the box scale. The value is the percentage of layer, not including outlier and extreme.
Note: the weight of the box scale follows the box weight in the plot. It can be customize in the Box tab of Plot Details dialog. |
|---|---|
| Label Offset
(% of Font) |
Specify the gap value between label and symbol. The value is the percentage of font height. |
| Black Edge and No Fill | Set the edge color to Black and the fill color to None for the box style, regardless of the box style.
If not check, the box scale style will follow the first box in the plot. |
| Labels in Line | All labels in one line and align to left. |
| Font | Custom the font style of the labels.
|
| Label Rotate | Origin supports arbitrary rotation of the label in box scale.
<Auto> means 0 for horizontal layout, 270 for vertical layout. |
| Layout | Set the box scale layout to horizontal or vertical.
Auto means following plot. If layer exchange xy, then box show horizontally in the graph, then the object will use horizontal layout |