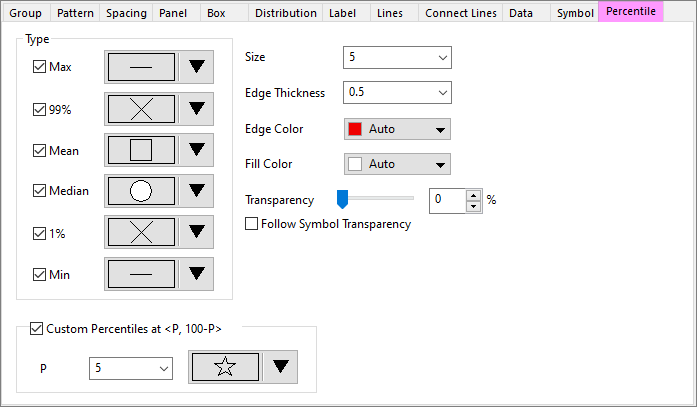
The Percentile tab provides controls for customizing the symbols that display at certain percentiles.
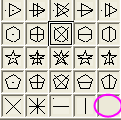
Click the down arrow![]() next to the symbol/statistic that you want to change. Select the desired symbol from the symbol gallery that opens.
next to the symbol/statistic that you want to change. Select the desired symbol from the symbol gallery that opens.
To display no symbol, choose an empty cell in the symbol gallery.
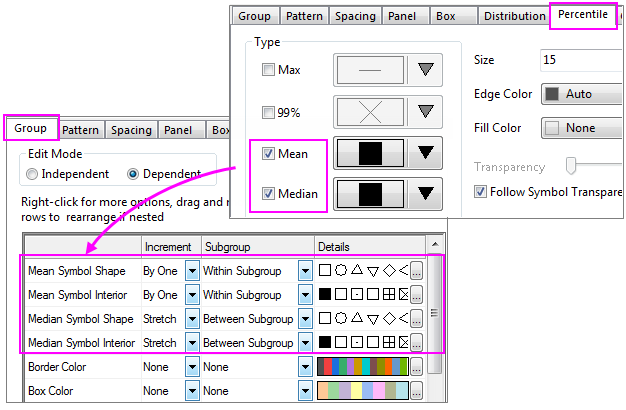
Origin supports to customize different shape for Mean/ Median percentile in the Group tab of the Plot Details dialog, When check the Mean/ Median this Percentile tab, you can find Mean Symbol Shape and Mean Symbol Interior / Median Symbol Shape and Median Symbol Interior listed under the group incrementing controls table in the Group tab.
If the Increment = None for above option, the percentile symbol type will follow the setting in this Percentile tab. |
Specify whether to show the custom percentile symbols in the box graph.
When the Custom Percentiles at <P, 100-P> check box is selected, the percentile value can be selected or typed in P combo box.
To select the desired symbol from the symbol gallery, click on the down arrow![]() under this section.
under this section.
Set the point size for all symbols in the drop-down list.
Control of percentile symbol edge thickness. Units = point size. Same as Symbol tab Edge Thickness when Scale by Symbol Size is unchecked.
Set the edge color for all symbols.
Set the fill color for all symbols. Note that some symbol types in the gallery do not have a separate fill color and use the edge color for fill or have no fill color.
This controls percentile symbols transparency. Move the slider or enter an integer from 0 to 100 in the combination box. Note that 0 means the percentile symbols is not transparent at all, and 100 means the percentile symbols is fully transparent.
When Follow Symbol Transparency is checked, the transparency of the percentile symbols will be the same as that of the symbol.