3.6 FAQ-226 如何选择图中的部分数据进行拟合?
Last Update: 7/15/2018
有以下几种方法可供选择:
- 激活图形窗口,点击位于工具 (Tools) 工具栏上的数据选择 (Data Selector) 工具
 。则将会看到在绘图的起始和结尾各有一个标记。单击每个标记并将其移动到期望的始末位置。移动标记时,可以在数据显示窗中实时读取到 x,y 坐标值。定位每个标记后,双击或者 Enter 键设置此范围。
- 使用区域数据选择器工具
 。使用此工具,可以在图形上拖动以框选要拟合的区域。使用此工具也将显示一对数据标记,来指示哪些数据将被拟合。
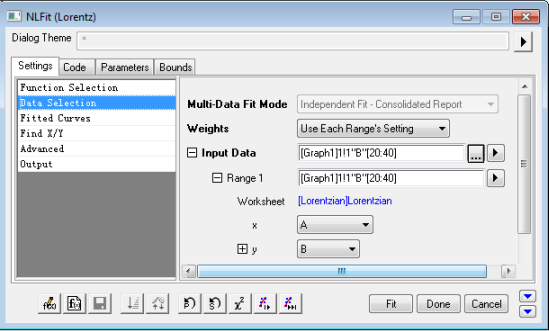
- 通过选择 Analysis: Fitting: Nonlinear Curve Fit 打开 NLFit 对话框。在 Settings 选项卡下选择 Data Selection,则在 Input Data 和 Range 1 两个节点的输入框中将会显示数据的起始值和结束范围。如下例图中显示的范围是 [20:40],这意味着将只对此范围内的数据执行拟合操作。
 。选择 Select Range from Graph,这将使数据选择器标记返回到图形上的编辑模式,以便将它们定位到新值。
如果使用的是 Origin 8.6 或更高的版本,还是可以展开 Input Data: Range 1: Rows,然后选择 By X 来通过 x 值定义数据范围,例如,在 From 编辑框中输入 10,在 To 编辑框中输入 45, 则将会选择 x 的数据范围介于 10 至 45 区间的数据,同时 Range 1 将会变为 [Lorentzian]Lorentzian!(A,B)[x10:45]。
Keywords:subset, select, range, selector,子集,选择,范围,选择器
- FAQ-976 Why does my Analysis Template file keep getting bigger?
- FAQ-222 What is the difference between global fit and independent fit?
- FAQ-223 How do I set the same bounds to parameters when fitting multiple datasets?
- FAQ-224 How to use the parameter values from the last fit as the new starting values
- FAQ-225 How do I fit all curves in my layer or graph?
- FAQ-226 How do I fit a part of the data plot in my graph?
- FAQ-228 How do I force my fit curve to go through a point?
- FAQ-231 How do I know if my fit result is good?
- FAQ-232 How to identify the outliers in linear fit?
- FAQ-233 How to find a slope on the log-log plot?