4.3.2 Scrolling and Simple Data Selection in the Worksheet
Contents
- 1 Unused Worksheet Cells, Shaded Background and Missing Values
- 2 Selecting cells (contiguous or non-contiguous selection)
- 3 Selecting columns (contiguous or non-contiguous selection)
- 4 Selecting rows (contiguous or non-contiguous selection)
- 5 Selecting the entire worksheet
- 6 Scrolling to a specified column or row number
Plotting and analysis operations are generally performed on selected data in the active worksheet.
|
Note: Many of Origin's X-Function-based dialog boxes have one or more interactive range selection controls that, when activated, allow the "hunt" for data in the Origin project. Use of this control is covered under Specifying Your Input Data. |
Unused Worksheet Cells, Shaded Background and Missing Values
Beginning with Origin 2019, "unused" worksheet cells have a shaded background. This was added to clarify which column data are being counted in plotting and analysis operations. In the following image, you can see that in column A(X), there are three unused cells, followed by a sequence of seven used cells, followed by another sequence of unused cells.
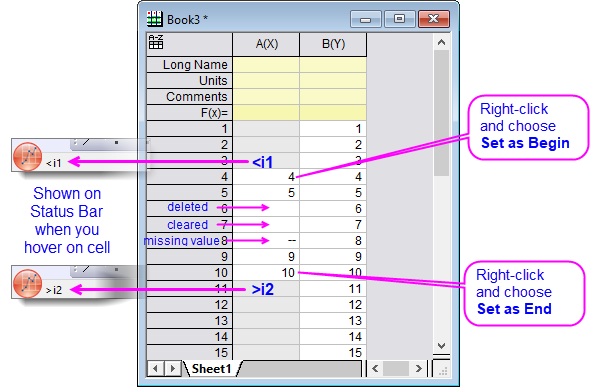
A few things to note:
- The (middle) sequence of used cells contains data-containing cells, empty cells, and cells showing the missing value symbol ("--").
- Within a given column, those cells of index number less than the first used (unshaded) are considered to be "<i1" -- that is, less than the index of the first used cell in the column. Additionally, those cells of index number greater than the last used cell are considered to be ">2" -- that is, greater than the index of the last used cell in the column.
- Index numbers "i1" and "i2" are two values that Origin uses internally to define a column row range to be considered in plotting and analysis operations. We say "considered" because, depending on the operation, empty cells or cells containing missing values may be counted or they may not be counted (consult documentation for individual tools to determine how empty cells and missing values are handled). For the most part, the user needn't bother with quantities "i1" and "i2". The background shading of worksheet cells will be your visual indicator of "unused cells."
- Prior to Origin 2019, if you skipped over cells while entering data manually into a column, or you clicked on a cell and chose Clear from the Edit or shortcut menus, a missing value symbol ("--") was placed into the worksheet cell. Beginning with Origin 2019, those skipped cells will display as empty, by default. To revert to the pre-2019 behavior, set LabTalk System Variable @CDB = 0 (for information on changing the value of a system variable, see this FAQ).
You can manually add the missing value symbol ("--") to worksheet cells in 2019 without changing the value of @CDB. See Missing values in the worksheet or matrixsheet for information. |
Selecting cells (contiguous or non-contiguous selection)
- To select a contiguous group of worksheet cells with your mouse, click-and-drag to select the cells (see Selecting Columns or Rows, below).
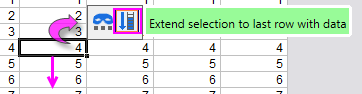
- To extend selection to the last data-containing row in the column, you can also make use of a worksheet Mini Toolbar button.
- To select all cells between the selected cell in row (i), column(j) and the cell in the upper-left corner of the sheet, press CTRL + SHIFT + HOME.
- To select non-contiguous cells in the worksheet, hold down the CTRL key while making multiple range selections.
- To select cells up to any empty/missing value cells, hold CTRL + SHIFT and press the Arrow keys to make the selection. Repeating the operation will select those cells with empty/missing values, plus the next value-containing cell. Alternately, you can force selections beyond empty/missing cell values by setting @ESL = 1. See this FAQ for information on changing the value of a system variable.
|
Note: Pressing the CTRL key, you can make non-contiguous selections within a single column of worksheet data. Each selection creates a separate plot. Multiple non-contiguous selections, when plotted, will create a plot group, with a Group tab being added to the graph's Plot Details dialog box. |
Selecting columns (contiguous or non-contiguous selection)
- To select contiguous columns in the worksheet, click to select the first column heading in the desired range and then drag the pointer to the last column in the desired range. Release the mouse button to select the columns. Alternately, click to select the first column heading in the desired range, then scroll the worksheet (using the scroll bars at the bottom of the worksheet, as needed) to display the last column in the desired range. Hold the SHIFT key and click on this last column heading.
- Alternate selection for contiguous columns: Select column, press SHIFT and use the LEFT or RIGHT arrow keys to select adjacent columns.
- To select non-contiguous columns in the worksheet, click to select the first column heading, then hold the CTRL key while clicking on additional column headings.
Selecting rows (contiguous or non-contiguous selection)
- To select a contiguous row range, click to select the first row heading in the desired range and then drag to the last row in the desired range. Release the mouse button to select the rows. Alternately, click to select the first row heading in the desired range, scroll the worksheet to display the last row in the desired range, and then hold down the SHIFT key and click on this last row heading.
- Alternate selection for contiguous rows: Select row, press SHIFT and use the UP or DOWN arrow keys to select adjacent rows.
- To select non-contiguous rows, hold down the CTRL key while dragging to select.
Selecting the entire worksheet
To select all the columns in the worksheet, do one of the following:
- Point to the blank space in the upper-left corner of the worksheet and when the pointer becomes a downward pointing arrow, click once to select all columns (datasets) in the worksheet.
- Click to select the first cell (upper-left), then press CTRL + SHIFT + END to extend selection to the last filled cell in the sheet (lower-right)
- Click to select the first column heading, then drag the pointer across all remaining column headings in the worksheet.
- Click to select the first column heading, then scroll the worksheet until the last column is visible and press the SHIFT key while clicking on the last column heading.
Scrolling to a specified column or row number
To find a specific column or row in the worksheet:
- Choose Edit: Go to or right-click inside the worksheet window (but to the right of the worksheet grid) and select Go to from the shortcut menu.
- In the Data Exploration dialog, type the column/row number in the Go to Column/Go to Row text box and click OK. Specifying both the column and row number, will find the intersecting cell.