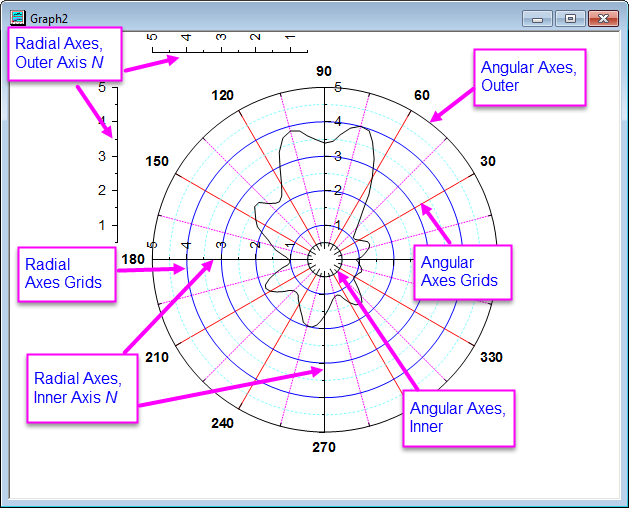
Origin's polar graphs can display both "angular" axes and "radial" axes. There are two angular axes, an inner and an outer. They can be hidden or shown and can be be customized much as a conventional Cartesian axis is customized. Radial axes can be shown inside of or external to the plot. Radial axes are also fully customizable. Axis customizations are made from the polar graph's Axis dialog box. The top image below shows an Axis dialog, displaying controls for multiple inner and outer radial axes (e.g. Inner Axis 1, Outer Axis 2). The diagram at the bottom depicts the types and locations of Origin's polar graph axes and grids.
|
|
| Axis dialog for Polar Graph |
|
|
| Terminology of Axes in Polar Graph |
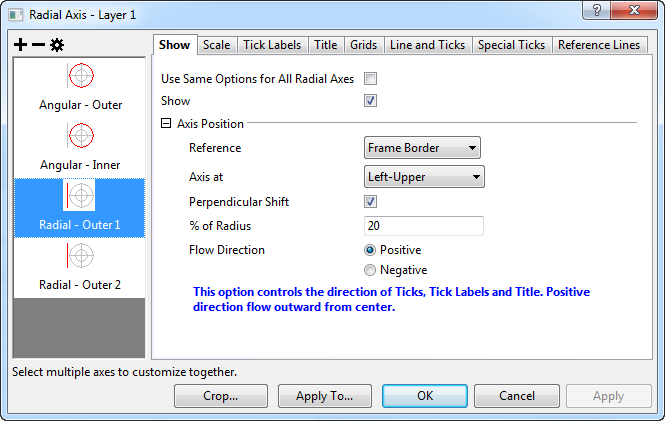
The Axis dialog is a tab-based dialog with controls to customize axes in the Polar graphs. There are 7 tabs in this dialog to separately control different attributes in an axis. To get a quick start with this dialog, basically first select one or more icons (hold Ctrl key to select multiple icons) in the left panel. These icon(s) indicate the axis(axes) to be customized. Then in the right panel, select a tab and use the controls to customize that axis attribute.
The Angular axes are the axes for the  values. They are shown as a circle(or part of a circle). There can be both outer and inner Angular axes, the initial positions of inner/outer Angular axis are at the From/To values of Radial Axis, respectively.
| Use Same Options for Outer and Inner | Specify whether to use the same settings for outer and inner Angular axes. |
|---|---|
| Show | Specify whether to show the selected Angular axis. |
| Orientation | Determine the direction and axis start value for the Angular axes which are shown.
|
This tab controls the axis range and increment. Most controls are identical to the Scale tab in the general 2D Axis dialog box; only the Units Definition tree node is unique to Polar Axis dialog.
| Units | Specify the units of the Angular axes which are shown.
|
|---|---|
| Circle Start Value | This is only available when Custom is chosen for Units. It is used to specify the start value of the custom unit. Its value will be considered as equivalent to 0 degrees when the unit is converted. |
| Circle End Value | This is only available when Custom is chosen for Units. It is used to specify the end value of the custom unit. Its value will be considered as equivalent to 360 degrees when the unit is converted. |
For the other controls in this page, please refer to the help file for Scale tab in the general 2D/3D Axis dialog box.
Notes:
|
You can customize the tick labels for the outer Angular axis in this tab
| Show | Specify whether to show the tick labels of the selected Angular axis. |
|---|---|
| Use Same Options for Inner and Outer | Specify whether to use the same tick label settings for outer and inner Angular axes. |
The Display subtab controls the tick label display. Most of the controls are shared with the general 2D Axis dialog. A few options are specific to polar Angular axes.
| Type | Determines the type of tick label display. See the option reference for Type drop-down menu for details. |
|---|---|
| Display | This is NOT available when the Type is set to Text from dataset, Tick-indexed dataset or Categorical.
Determines the display format of tick labels. See the option reference for Display drop-down menu for details. |
| Dataset Name | This is only available when the Type is set to Text from dataset, Tick-indexed dataset or Categorical.
Determines the dataset used for tick labels. See the reference of Dataset Name drop-down for details. |
| Set Decimal Places | This is only available when the Type is set to Numeric.
It controls whether to set the decimal places of tick label. |
| Decimal Places | This is only available when the Set Decimal Places box is checked and when Type is set to Numeric. |
| Show Negative Labels as Positive | This check box is only available when the Type is set to Numeric.
Controls whether to convert tick label(s) with negative values to positive values. |
| Label Form | Determine the display unit for tick labels.
|
| Divide by Factor | This is a general control for the 2D Axis dialog. See this help file for details. |
| Formula | This is a general control for the 2D Axis dialog. See this help file for details. |
| Prefix | This is a general control for the 2D Axis dialog. See this help file for details. |
| Suffix | This is a general control for the 2D Axis dialog. See this help file for details. |
The Format tab provides controls for the tick label format. The controls are generally the same as the Format tab in the general 2D Axis dialog except that it does not have Wrap Text option.
The Minor Tick Labels tab provides options to specially customize the tick labels for minor ticks. The controls are similar to the Minor Tick Labels tab in the general 2D Axis dialog.
This tab is used to control the Angular axis title.
The Show check box is used to specify whether to display a title for the specific Angular axis.
The other controls are generally the same as the Title page controls of the general 2D Axis dialog.
This tab provides options to customize the Angular axis grid lines, i.e. the grid lines radiating outward from the origin.
The Major Grid Lines and Minor Grid Lines tree nodes can be used to control the grid lines at major ticks and minor ticks, most of the controls are the same as Major/Minor Grid Lines tree node in general 2D Axis dialog.
The Additional Lines tree nodes can be used to display the opposite line and the line at specified Angular axis value.
| Opposite | Specify whether to display opposite line that is at the position of inner angular axis |
|---|---|
| Y = | Select the Y= check box to enter a value in the box to add a line at specified Angular axis value. |
This tab controls line style and ticks in the Polar Angular axes.
In the Line and Ticks page, three check boxes are available to determine the overall line and ticks option.
| Show Line and Ticks | Specify whether to display line and ticks on the selected Angular axis. |
|---|---|
| Use Same Options for Inner and Outer | Check this check box to use the same line and ticks options for both outer and inner Angular axes. When the box is checked, the Show Line and Ticks check box on Inner Axis page is unavailable and its status will automatically be the same as Show Line and Ticks on Outer Axis page. |
The Line tree node provides options to customize the line style:
| Show | Check on this check box to display line on the selected axis. |
|---|---|
| Color | Select or define a color from this drop-down list and use it as the display color of axis lines and ticks. |
| Thickness | Type or select the desired line thickness (in points, where 1 point=1/72 inch) for the axis and ticks. |
| Axis Offset | Set the offset of the corresponding Angular axis.
|
| Percent/Value | This input box is only available when the Axis Offset is set to % From Initial Position or At Position=. It is used to determine the percentage/value of axis offset. If % From Initial Position is chosen, enter a percentage value. Both positive and negative percentages are allowed. If At Position= is chosen, it should then be an arbitrary value with respect to the Radial Axis. |
The Ticks tree node provides options to customize the tick direction and length. The options are shared with the Major/Minor Ticks tree node in general 2D Axis dialog.
Just as axes in the Cartesian coordinates, you can add reference lines on the angular axis of a polar coordinate with the options in the Reference Lines tab.
About how the options work, you can refer to the Reference Lines tab of axes in Cartesian coordinates.
For angular axis of a polar graph, the reference line will show as straight line which starts from the From value and stops at the To value of radial axis.
You can add one or more special tick labels at certain axis positions on the Angular axes.
| Use Same Options for Inner and Outer | Check this check box to use the same ticks options for both outer and inner Angular axes. |
|---|
In this tab, you can customize the style of special ticks on the outer Angular axis if they are chosen to be shown in the Special Ticks tab. The options are shared with the Special Ticks tab in general 2D Axis dialog.
The Radial Axes can be shown inside or outside the polar graph. Inside axes radiate from the center, and are named as Inner Axis n. Outside axes are drawn outside the frame of the polar graph and are named as Out Axis n.
You can add radial axes to every major tick on the Angular axes and customize them all simultaneously.
For theRadial Axes, you can determine the initial configuration of Radial Axes by two methods:
This dialog box is used to quickly set the configuration for all Radial Axes. The current Radial Axes configuration will be lost when a new configuration is applied.
In this dialog, the Axes Inside Polar and Axes Outside Polar are controlled in separate tree nodes.
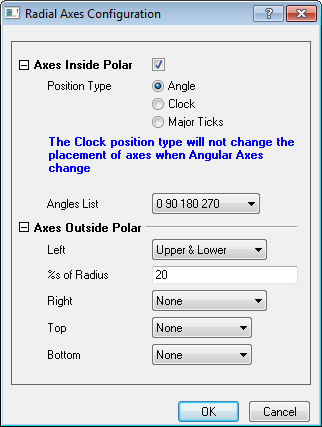
| Axes Inside Polar | This check box is used to specify whether to show Radial Axes inside the polar graph. If it is deselected, all other controls in this tree node will be disabled and no axes will be shown inside the polar graph, i.e. no Inner Axis. |
|---|---|
| Position Type | Determine the position type of all Inner Axis
|
| Angle List | This drop-down list is only available when the Angle radio button is chosen for Position Type. You can choose a built-in angle list for radial axes or choose Custom and then create a user-defined angle list in the Value (Angular Units) input box. |
| Value (Angular Units) | This input box is only available when Custom is chosen for Angles List. Angular Units is changed according to the Units defined in Angular Scale tab. You can define the position of Radial Axes by entering one or more angle value(s) in Angular axes. Use "space" as a delimiter. |
| Clock List | This drop-down list is only available when the Clock radio button is chosen for Position Type. You can choose built-in clock list for radial axes. |
There are four drop-down lists under this tree node: Left, Right, Top and Bottom. Each determines whether to show axes in the corresponding frame border, e.g. the Left drop-down is used for the radial axes at the left frame border line.
These drop-down menus have similar options:
| None | Do not display radial axes at this frame border. |
|---|---|
| Upper or Left | Only display the upper (for Left and Right) or Left (for Top and Bottom) Radial axis at this frame border. |
| Lower or Right | Only display the lower (for Left and Right) or Right (for Top and Bottom) Radial axis at this frame border. |
| Upper & Lower or Left & Right | Display both upper and lower (for Left and Right) or both left and right (for Top and Bottom) Radial axes at this frame border. |
For each drop-down, as long as None is NOT chosen, there will be an additional input box %s of Radius. You can enter a value here to define the offset of the corresponding Radial Axis(Axes) with respect to the end position of the Radius line, which is perpendicular to this Radius Axis.
On the Outer Axis n or Inner Axis n or Major Axes page, you can decide whether and where to show the Radial axis.
The Show check box is provided to specify whether to display the selected Radial axis.
The Axis Position tree node provides options to decide where to show the selected Radial axis:
| Reference | This drop-down is used to determine whether to show Radial Axes inside or outside the polar graph, and for Inner Axis, to determine whether to use Angular axes or clock direction as the reference.
|
|---|---|
| Angle At | This drop-down is only available when the Angular Axes option is chosen for Reference, and it is used to specify the axis position using the angle value at the angular axes.
|
| Value (Angular Units) | This input box is available when the Angle At drop-down is set to % From Start Angle or % From End Angle or Angle At. The Angular Units is changed according to the Units defined in Angular Scale tab.
|
| Clocks | This drop-down menu is only available when the Clock Dial option is chosen for Reference. It has 4 options to put the Radial axis at 3, 6, 9, 12 O'clock direction, respectively. The axis position will not change with the Angular axis. |
| Axis at | This drop-down menu is only available when the Frame Border option is chosen for Reference. It has 8 options to place the Radial axes at specific positions outside of the frame. |
| Perpendicular Shift | This check box is used to specify whether to offset in the perpendicular direction. |
| % of Radius | This input box is only available when the Perpendicular Shift box is checked. This value will be used to define the offset in percentage of Radial axis. It works the same with the %s of Radius input box in the Radial Axis Configuration dialog. |
| Flow Direction | This is used to control the direction of ticks, tick labels and title. It is related to the Angular axis orientation and Radial axis reference type. A hint will be provided in the dialog illustrating the positive flow direction under current settings. The negative direction is just a reverse of the positive direction. |
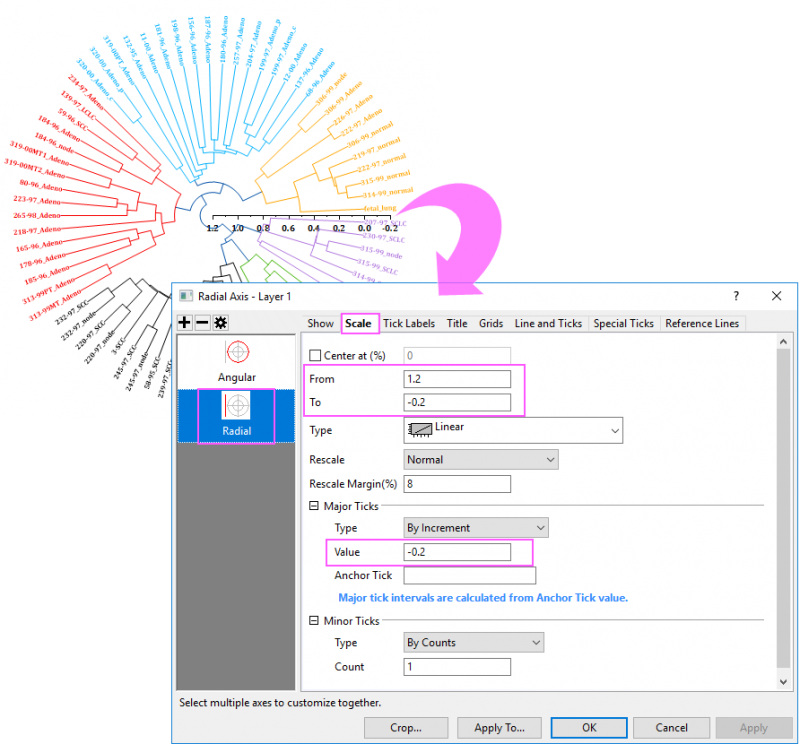
This tab provides controls to determine the axis range, axis type, tick positions, etc. of all Radial Axes. It is basically the same as the Scale tab in the general 2D Axis dialog, except that one check box is unique for Radial Axes in the polar graph:
| Center at (%) |
Enter a percentage value of the distance between From and To value to specify the distance from the center value to From value. For example, if the radial axis is from 50 to 100, and want to set the center at 40, then you can enter this percentage: By default, this value is 0. That means the center of polar graph will be fixed at the origin point (r=0) regardless of the From value of the Radial Axes. |
|---|
Note:
See the Circular Dendrogram plot as below:
In this tab, you can customize the tick labels of the specific Radial axis:
| Display | This tab provides control of tick label display. It is identical to the tick label Display controls in the standard 2D Axis dialog. |
|---|---|
| Format | This tab provides controls to customize the tick label format. It is generally the same as the tick label Format controls in the standard 2D Axis dialog except that it does not have Wrap Text option. |
| Minor Tick Labels | This tab provides options to specially customize the tick labels for minor ticks. The controls are similar to the Minor Tick Labels tab in the general 2D Axis dialog. |
This tab is used to control the Radial axis title.
The Show check box is used to specify whether to display a title for the specific Radial axis.
The other controls are generally the same as the Title page controls of the general 2D Axis dialog.
This page provides options to customize the grid lines of Radial axes, i.e. the circles concentric to the Angular axes.
Major and minor grid lines can be customized separately in the Major Grid Lines or Minor Grid Lines tree node. The controls of these two tree nodes are shared with the corresponding tree nodes in the Grids tab of the general 2D Axis dialog.
This tab is used to customize the line and tick styles of Radial axis.
The Show check box is used to specify whether to display line and ticks for the specific Radial axis.
The other controls are generally the same as the Line and Ticks page controls of the standard 2D Axis dialog.
Beginning with Origin 2023, axis line ends for radial (but not angular) axes are square by default and controlled by system variable @LCAL. |
Just as axes in the Cartesian coordinates, you can add reference lines on the radial axis of a polar coordinate with the options in the Reference Lines tab.
About how the options work, you can refer to the Reference Lines tab of axes in Cartesian coordinates.
For radial axis of a polar graph, the reference line will show as circle or part of circle which starts from the From value and stops at the To value of angular axis.
This tab is used to add/remove/edit special tick labels on the Radial axis.
The controls are identical to the Special Ticks page controls of angular axes.
Click the Crop... button to open the Miscellaneous dialog. Graph elements outside the defined rectangle shape will be removed from the graph.
| Enable | Select this check box to enable cropping. Only when this box is checked, will the other controls in this page be activated. |
|---|---|
| Units | Select the unit to define the dimension of rectangle.
|
| Left | This input box is used to define the position of the left line of the rectangle. |
| Top | This input box is used to define the position of the top line of the rectangle. |
| Width | This input box is used to define the width of the rectangle. |
| Hight | This input box is used to define the height of the rectangle. |
Click the Apply To... button to open the Apply To dialog. This dialog can be opened by clicking the Apply To... button at the bottom of the Axis dialog. You can specify format of Tick Labels and Line and Ticks, and Grib Lines to apply from source axis to objective axis.
This dialog works similarly with the Apply to Others page in 2D graph Axis dialog.