

|
|
|
This tutorial will introduce you to the Origin workspace. You will learn about the different kinds of Origin windows that make up a Project, how to manipulate these windows with Project Explorer, how to manipulate layers and plots with Object Manager and how to manage Apps with Apps Gallery.
Minimum Origin Version Required: Origin 2016 SR0
This tutorial will show you how to:
The Origin Title Bar displays the Origin(Pro) version, any open project name and the current folder within that project (if any) along with the standard Window controls for moving, sizing and closing the window.
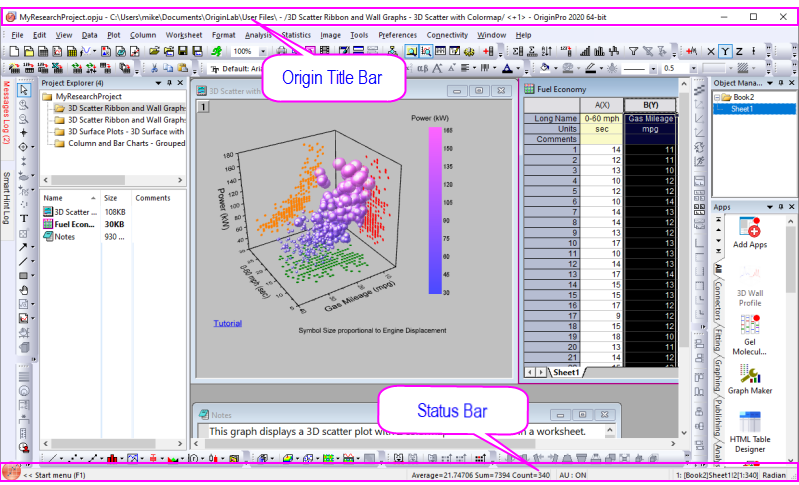
The Status Bar appears at the bottom of the Origin workspace and hosts the Start Menu; plus it displays messages, the state of Auto Update, summary statistics (user-customizable) of currently-selected worksheet cells, Child Window Theme (if any), Last active Workbook, Current Window and Angular Units indicator.
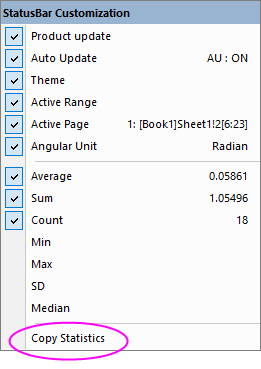
The Auto Update item on the Status Bar shortcut menu relates to the current state of all auto-updated recalculation operations. Normally, you will see AU: ON on the status bar, indicating that any change to input data will trigger automatic recalculation of output where the Recalculate Mode is set to Auto. When a large number of such operations slow your work, consider turning Auto Update OFF. When ready, you can turn it back on or trigger manual recalculation of output. |
The Origin menu dynamically changes according to the active Child Window. Some menus (Help, File, Edit, etc.) appear on all Child Window menus, although their content may change.
Thus, we say that the menus are "context sensitive." They will change depending on which type of Child Window is active.
Note: New Child Windows may be added by selecting the File: New menu option or clicking the appropriate button on the Standard Toolbar. All Child Windows have standard controls for moving and sizing and windows can be placed anywhere within the Origin workspace. The Window menu has options (cascade, tile) for arranging child windows within the workspace. In the central Origin Workspace is where you will find all Origin Child Windows which can include:
Workbooks - The Origin workbook is the primary structure for organizing your data. Each workbook is composed of one or more, up to 255 worksheets.
Graphs - With Origin, you can create over 60 graph types, each from a built-in graph template. Graph windows can be embedded in a worksheet cell.
Matrices - The Origin matrix holds data and images and is required for many 3D graph types.
Notes - Notes windows are a text-only Origin child window useful for recording analysis procedures, making notes to students and colleagues, etc. You can embed notes windows in a worksheet cell.
Layouts and Excel (If you have Excel installed)
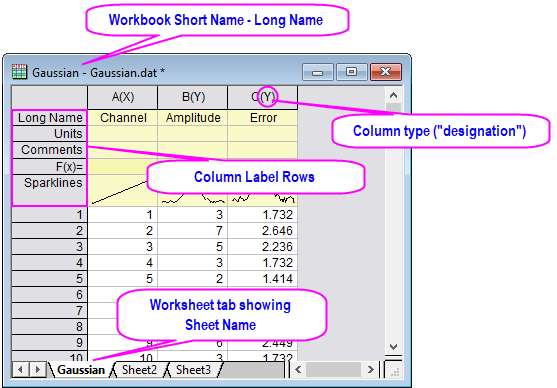
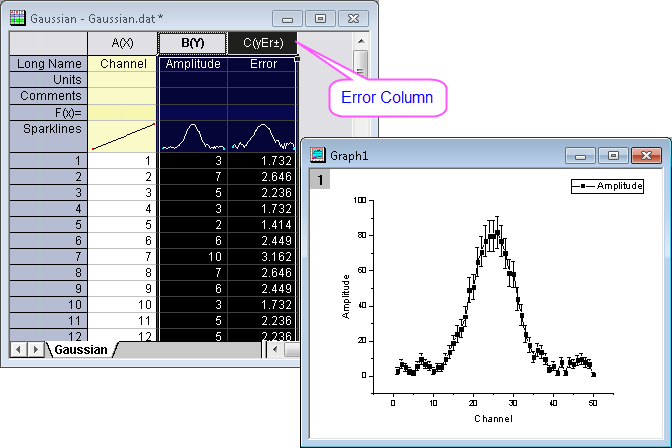
The Origin workbook is the primary structure for organizing your data. Each workbook is composed of one or more Origin worksheets. Each worksheet is generally composed of one or more worksheet columns or datasets. Columns in Origin have different column types ("designations") such as X, Y, Z, yError, etc, These user-configurable designations are used to determine how data should be treated for graphing and analysis purposes.
Origin and OriginPro projects can contain any number of workbooks (limited by system resources). Projects saved with the Student Version are limited to 30 windows total (graph, workbook, matrixbook, etc.).
To get familiar with manipulating Origin workbooks, try the following:
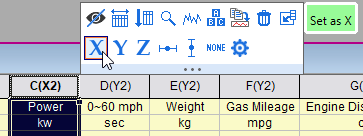
| Note: Do not delete this workbook and graph as we will revisit these windows in the section on Mini Toolbars. |
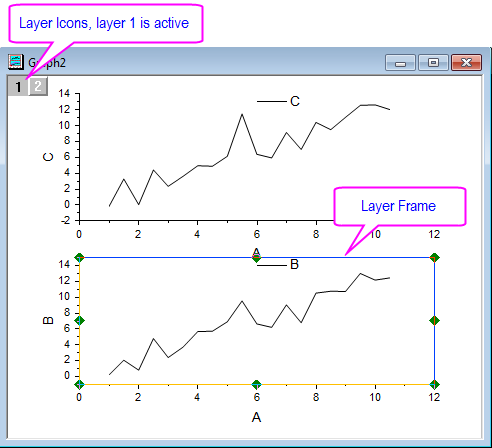
The Graph window is a container for graphical depictions of your experimental data and your analysis results. Graph windows may contain a single plot in a single graph layer or they may contain multiple plots in multiple graph layers.
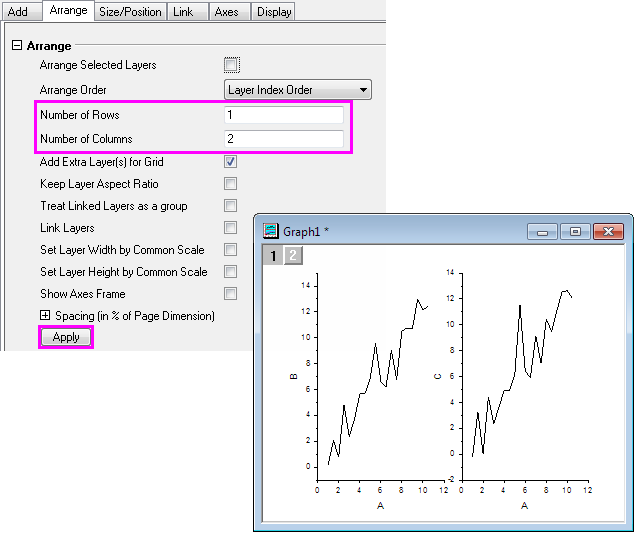
The graph layer is the fundamental unit of the Origin graph. The layer is comprised of a set of axis scale values, one or more data plots, and any included text labels, drawing objects, graph legends/color scales, button objects, etc. Graph layers can be created, sized, and moved independently of one another, allowing you a great deal of latitude in charting your data.
To learn how to organize layers in a graph window, try the following:
Most often you will use the worksheet for tabulating and manipulating your data, while you will use the graph window for plotting your data.
The Origin matrix window is a container for one or more Origin matrices. Each matrix window contains one or more matrixsheets, and each matrixsheet can contain one or more matrix objects. The matrix object itself, is a vector of Z values. These Z values are related to one another in the X and Y dimensions by their relative row and column positions in the matrix. Matrices are a precursor to constructing Origin's 3D graph types such as contour graphs and color-mapped surfaces, and since they are used in depiction and manipulation of 3D data, they are used by Origin in image processing and analysis. We will show you how to use the Origin Matrix to create a 3D plot in a later tutorial.
The Customize Toolbar dialog box handles displaying or hiding toolbars and toolbar buttons.
All these toolbars may be dragged away from their docked positions to become floating windows. Floating windows have additional controls besides the X to hide a window. A push-pin control can allow or prevent docking and a minimize button can roll-up a window to save space and restore the window when it is needed.
Below are the most commonly used toolbars.
Standard Toolbar

Worksheet Data Toolbar
Graph Toolbar

Format Toolbar

Style Toolbar

Tools Toolbar (vertical on the left side of the Origin workspace)

2D Graphs Toolbar

3D and Contour Graphs Toolbar
Mask Toolbar

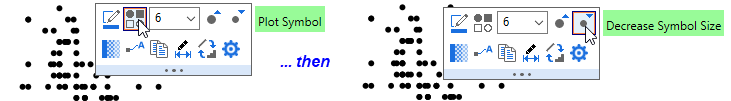
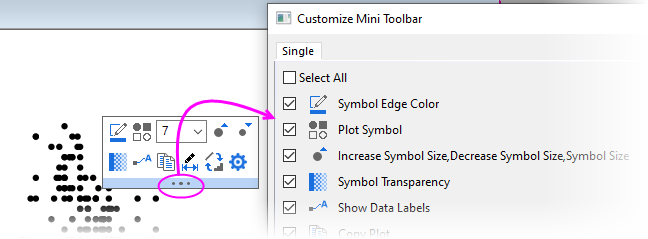
Mini Toolbars are context-sensitive tools made available for common workbook, graph and matrixbook editing and configuration tasks.
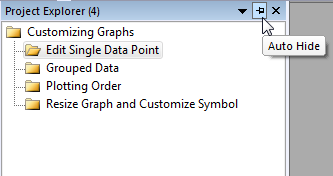
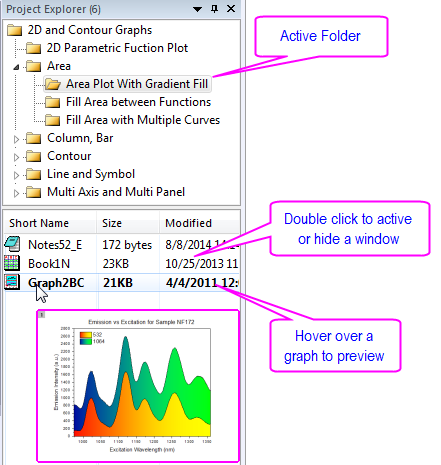
Project Explorer is a tool to help you organize your Origin data. It is particularly useful if you are working with a project that contains numerous child windows. Use Project Explorer to develop a folder structure to organize the child windows in your project.
When you first start Origin, Project Explorer displays docked to the edge of the workspace. You can dock it to any other edge or float it in the workspace. Because Project Explorer uses some of your workspace, you may want to close Project Explorer, even if you have already created a folder structure. To close/open Project Explorer, click the Auto Hide button to pin the Project Explorer, then press Alt + 1 or select menu item View: Project Explorer.
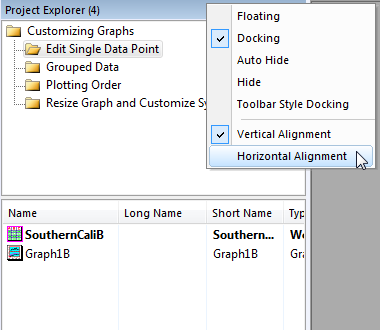
The project explorer can be auto-hidden, hidden, floating or docking. In another aspect, it has vertical and horizontal alignment.
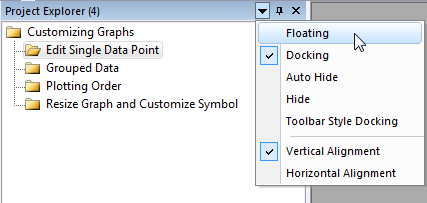
Note: Other dockable windows (Object Manager, Apps, Message Log, Smart Hint Log, etc.) have the similar controls to change the display properties.
There are two panels in Project Explorer: the folders panel and the contents panel, which displays all objects in the active folder. When you start a new Origin session, you can click the new workbook ![]() , new graph
, new graph ![]() or new matrix
or new matrix ![]() button to create some blank windows, and then you can see these window's icons in the contents panel. Double-click the icon to hide/view the window.
button to create some blank windows, and then you can see these window's icons in the contents panel. Double-click the icon to hide/view the window.
To create a new folder, right-click on the project folder (or a subfolder) in the folder panel, and select New Folder from the shortcut menu.
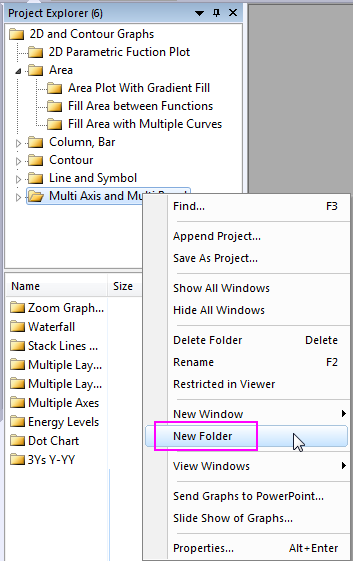
Once you have created one or more subfolders, you can move child windows between folders by dragging & dropping them within the Project Explorer workspace.
Object Manager provides a hierarchy structure to help you view and manipulate layers and plots in the active graph window. It is particularly useful if the graph contains multi-layers and each layer contains multi-plots.
When you first start Origin, Object Manager is docked to the right edge of the workspace. Like Project Explorer, you can dock it to any other edge or float it in the workspace. To close/open Object Manager, select menu item View: Object Manager.
Object Manager works interactively with active graph window. Selecting layer or plot in graph window will highlight the corresponding item in Object Manager and vice versa. This makes it very easy to select an item and then show or hide it.
For example, try the following:
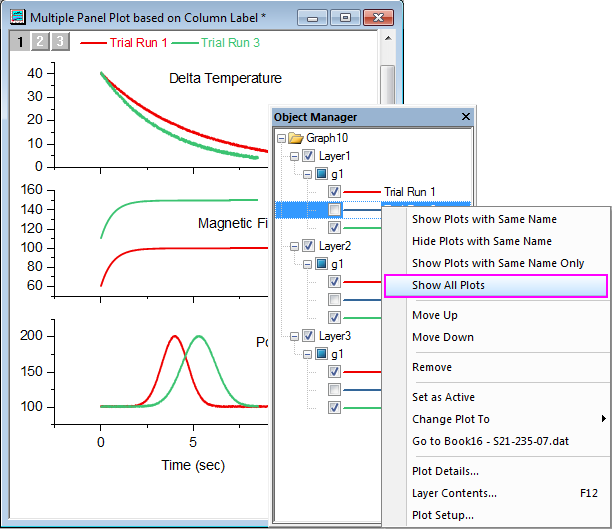
The plot names in Object Manager is the Auto Legend Translation mode set in the graph. Therefore same name or not depends on what the legend translation mode is used. |
Besides using Object Manager to turning on or off layers or plots, it can also be used to:
Apps are custom applications for Origin that perform specific graphing and/or analysis tasks. Apps are not pre-installed with Origin. If you want to get an App, you can
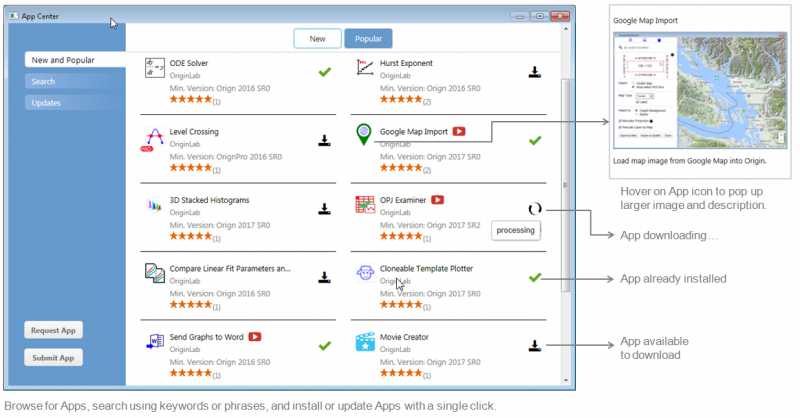
When Apps get installed, they will be visible in the Apps Gallery window of the Origin interface.
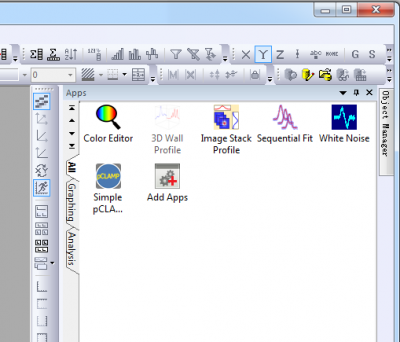
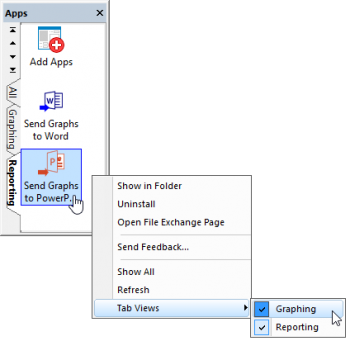
In the Apps panel, you can add new tabs from the context menu and then classify these installed APPs by putting them to different tabs, see "Graphing", "Analysis" tab in the above APP Gallery. All Apps will be presented in the All tab in the order of their installation times.
Each installed App will be displayed as an icon in the gallery window. You can simply click on the icon to launch the App and right-click on the icons for other options such as hiding, uninstalling the App or movement between the tabs.
Learning Center dialog helps you get started with Origin easily. You can select Help: Learning Center from Origin menu or press F11 key to open it.
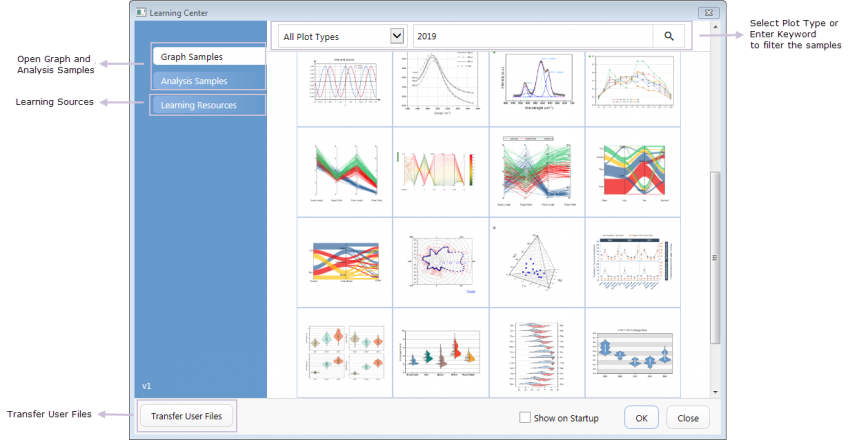
With this dialog, you can
The Messages Log window shows messages about operations including Output Information, Results and Errors. It displays messages that are not sent to the Script Window or the Command Window. To close/open Messages Log, press Alt + 6 or select menu item View: Messages Log.
