Hinweis:Dieser Abschnitt ist nur in englischer Sprache verfügbar. Wir bitten um Ihr Verständnis.
3.6 FAQ-226 How do I fit a part of the data plot in my graph?
Last Update: 2/3/2015
You have several options:
- With your graph active, select the Data Selector tool,
 , located on the Tools toolbar. You will see a marker at the beginning of the data plot and one at the end. Click on each marker to move it to the desired begin and end position. As you move the markers, you can read the x,y coordinate values from the Data Display window. When you have each marker positioned, double-click or press Enter to set this range.
- Use the Regional Data Selector tool,
 . With this tool, you can drag-n-drop to select a region on the graph to fit. A pair of data marker appears either to indicate what data will be inputted.
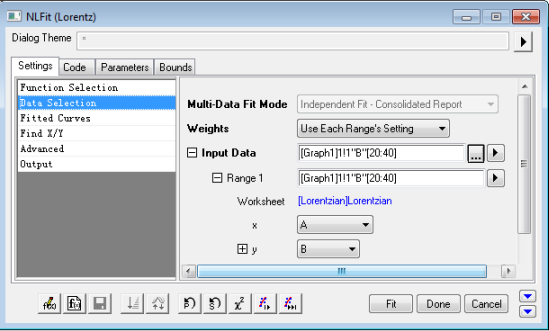
- Open the NLFit dialog, by selecting Analysis: Fitting: Nonlinear Curve Fit. On the Data Selection / Settings tab, the Input Data and Range 1 nodes will have from and to row number values in square brackets. In the example below it is [20:40], which means the fit will be performed on data in this range only.
 next to the Range1 node. Choose Select Range from Graph, which will put the data selector markers back into edit mode on your graph for you to position them to new values.
If you have Origin 8.6 or higher version, you can also expand Input Data: Range 1: Rows, and choose By X to specify the range by x values, e.g. type 10 in the From editbox and 45 in the To editbox, and it will choose the range whose x values are between 10 and 45, Range 1 is changed to [Lorentzian]Lorentzian!(A,B)[x10:45].
Keywords:subset, select, range, selector
- FAQ-976 Why does my Analysis Template file keep getting bigger?
- FAQ-222 What is the difference between global fit and independent fit?
- FAQ-223 How do I set the same bounds to parameters when fitting multiple datasets?
- FAQ-224 How to use the parameter values from the last fit as the new starting values
- FAQ-225 How do I fit all curves in my layer or graph?
- FAQ-226 How do I fit a part of the data plot in my graph?
- FAQ-228 How do I force my fit curve to go through a point?
- FAQ-231 How do I know if my fit result is good?
- FAQ-232 How to identify the outliers in linear fit?
- FAQ-233 How to find a slope on the log-log plot?