10.1.1 Magnifying or Zooming In on a Portion of the Graph
Zoom-Portion-of-Graph
Origin provides a number of tools and methods for zooming or panning your graph. Two methods of particular interest will enlarge a portion of your 2D graph and send it to a secondary graph:
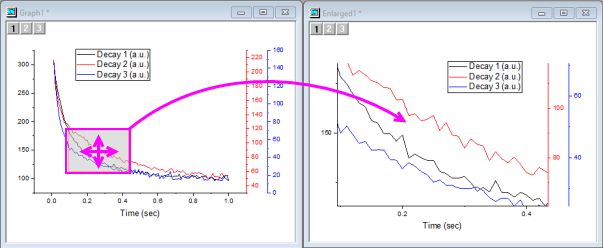
- Origin's Zoom Graph creates an interactive two-panel graph in which a movable, resizeable "region-of-interest" in the primary panel generates a an enlarged view in a secondary panel.
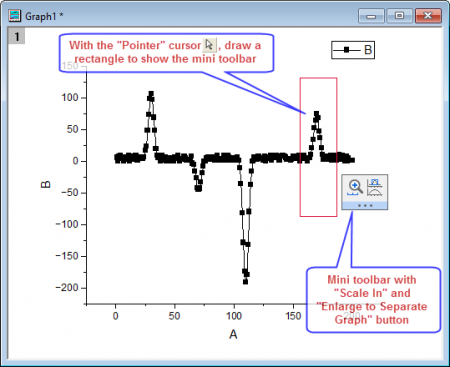
- You can use the Scale In button
 to copy an enlarged portion of your 2D graph to a new window. This will also work on any graph that has multiple linked layers as long as the layers are overlapped and share a common axis (% of Linked Layer has Left/Top set to 0 and Width/Height set to 100, plus Straight (1 to 1) linking to the parent layer).
- With a graph active, press CTRL then click the Scale In button (Tools toolbar) and drag out a rectangle(ROI) on your 2D graph.
- Note that this Enlarged graph is dynamic. Move or resize the rectangle on your original graph and the Enlarged graph is updated.
- To remove the rectangle from your original graph and simultaneously delete the enlarged graph window, select the rectangle and press Delete.
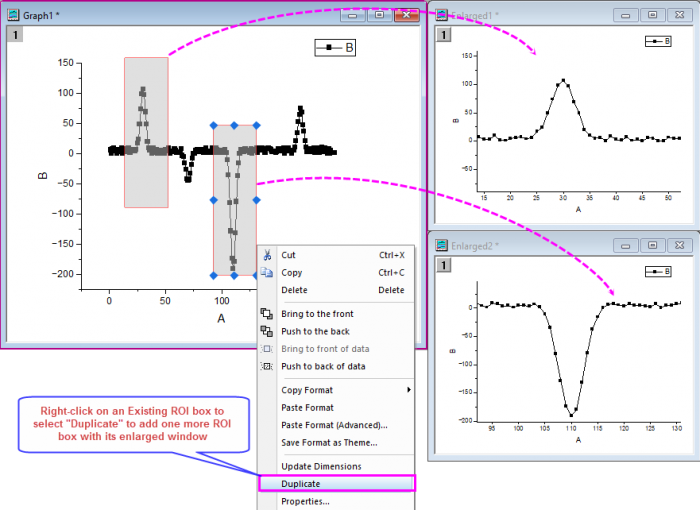
- Note: You are allowed to add multiple ROI boxes on the graph, then multiple enlarged graph windows will show to zoom in these ROI regions.
- You use the mini toolbar buttons to zoom in the region(s).
Additional Information
- For more information on Zooming, Panning and Scaling your graph see this page.
- For an overview of hotkeys for zooming, panning and rescaling graphs, see Zooming, Panning or Rescaling in the Origin User Guide.