Select at least one Y columns of values (or a range from at least one columns). If there is an associated X column, X column supplies X values; otherwise, sampling interval of the Y column or row number is used.
Select required data.
From the menu,select .
or
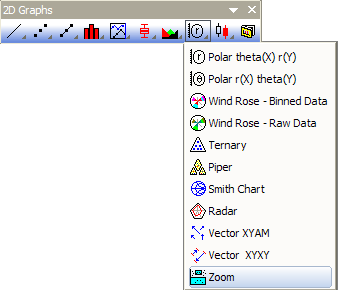
Click the Zoom button on the 2D Graphs toolbar.
Zoom1.OTP (installed to the Origin program folder).
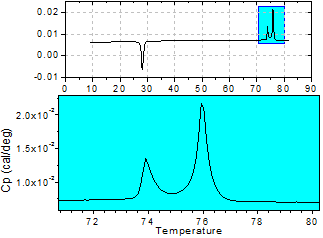
The Zoom graph includes each data set into both layers as a line plot. It can be changed to scatter, line + symbol, or column/bar through context sensitive menus or the Plot Details dialog box.
A rectangle in the top layer has been coded (i.e. a script is attached to it) so that when you move it, the region defined by its borders is automatically displayed in the bottom layer. The rectangle can be sized differently to further restrict or expand the region to be displayed.
You can use the Scale In button
For more information on Zooming, Panning and Scaling your graph see this page. |