This tool is used to move the active curve vertically or horizontally.
To use this tool:
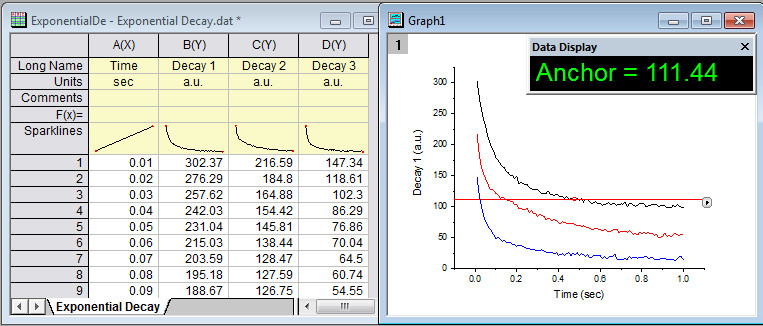
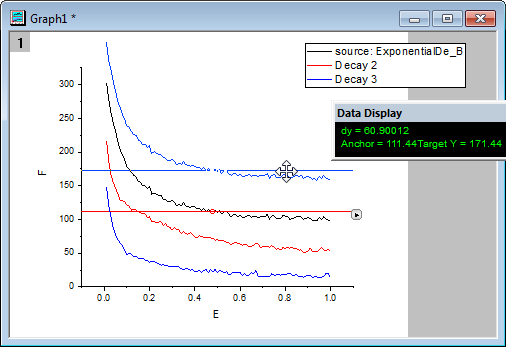
This tool will add an anchor and a red line to the active curve.
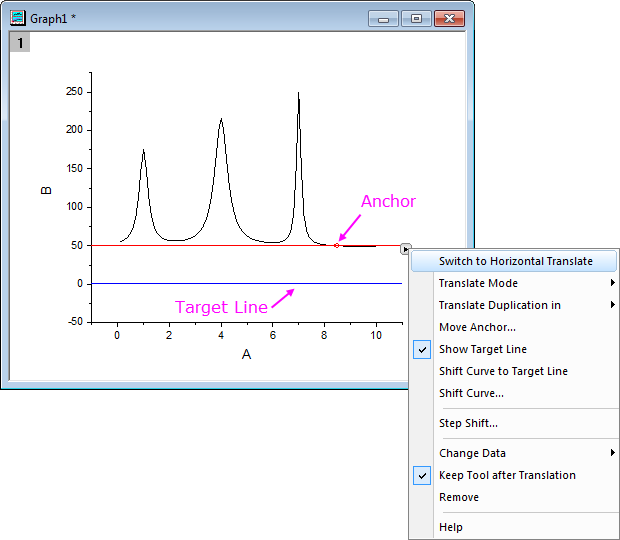
This tool can add a red line with an anchor (a small red ring) to the active curve to allow moving the entire active data plot horizontally or vertically. The moving direction depends on whether horizontal translate or vertical translate is selected.
You can click on the anchor line and drag it to move the active data plot to a new position. Moreover, you can set the new position by dragging the anchor on the line. The anchor always snaps to the active curve when you move the line.
If you drag the plot to a new position but want to cancel the moving, do not release the left mouse button and press the right button. Then release the right button, and then left button. The curve stays put.
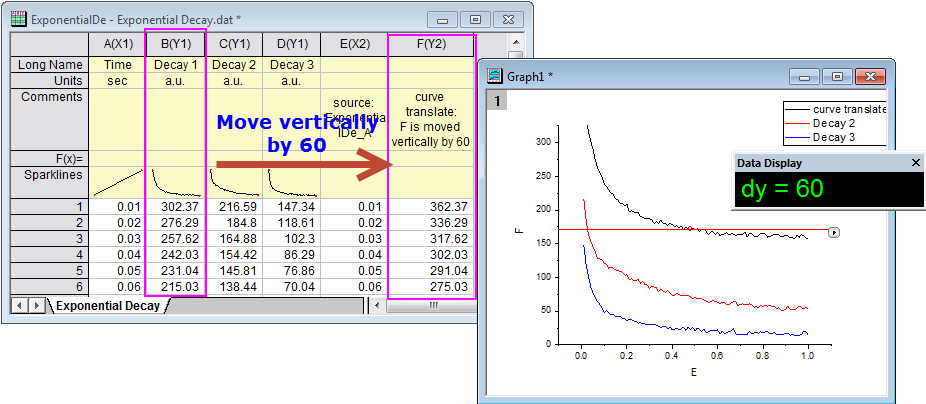
Note: when you translate a curve, the source data for the curve also will be changed.
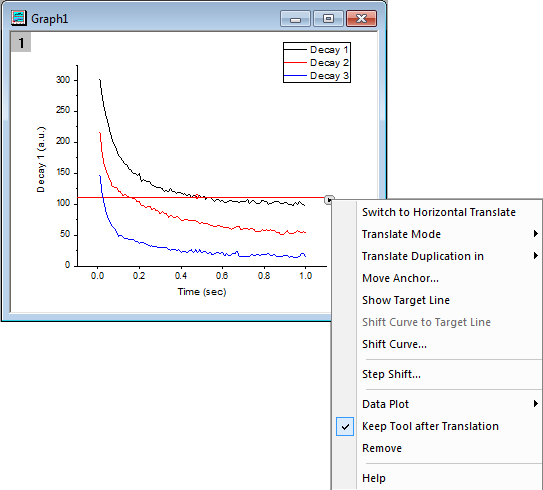
| Switch to Vertical/Horizontal Translate |
If you are using Vertical/Horizontal Translate, use this item to switch to Horizontal/Vertical Translate. |
|---|---|
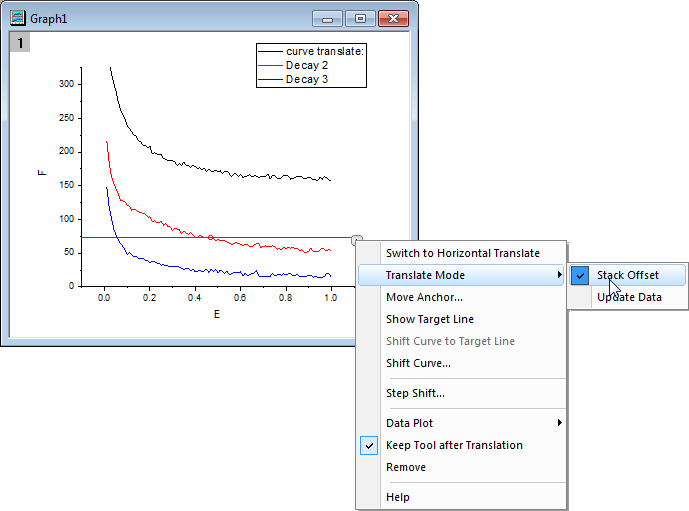
| Translate Mode |
|
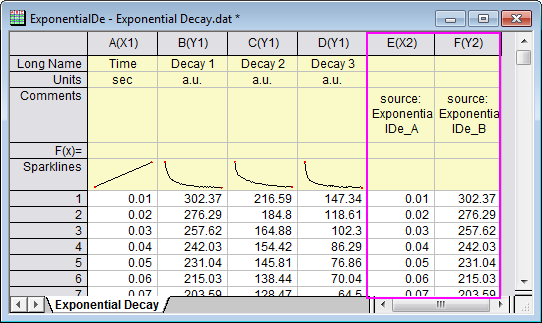
| Translate Duplication in |
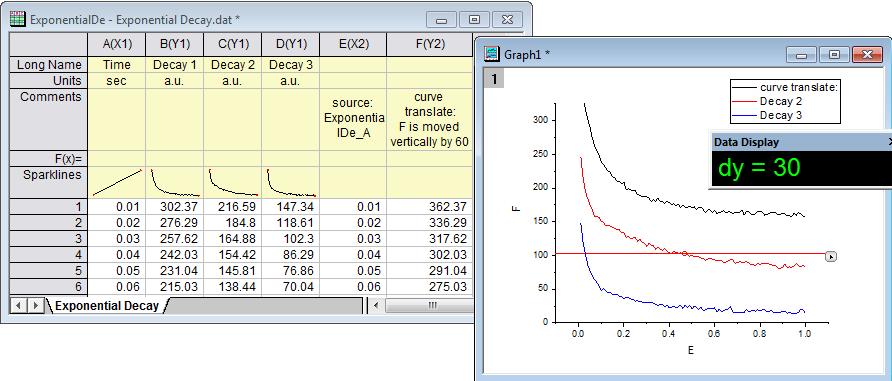
Only available when the Translate Mode is set to Update Data. When you select Translate Duplication in New Columns/Sheet/Book, the raw data of current curve is duplicated to new columns/sheet/book, and the duplicate one will be updated when moving the plot. If you don't select Translate Duplication in New Columns/Sheet/Book, moving the plot to a new location will change the raw data in the source worksheet. |
| Move Anchor... |
Opens the Move Anchor dialog box. It allows you to move the anchor to a specific position by data index or value.
|
| Show Target Line |
Specifies whether to show the target line. When the target line is shown, you can drag-n-drop the target line to the desirable position, and then select the Shift Curve to Target Line menu item to move the curve to the position defined by the target line. |
| Shift Curve to Target Line |
This is only enabled when the target line is shown. When selected, it will translate the current curve to the target line's position. |
| Shift Curve |
This opens the Shift Curve dialog to allow moving the anchor line (so as the curve) by a specified value or to a new position at a specified value. |
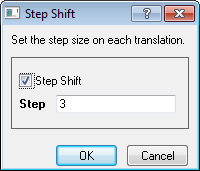
| Step Shift |
This opens the Step Shift dialog allowing you to specify a step size on each translation.
|
| Change Data |
Change the active plot to do translation. When you select a plot from the fly-out list, the anchor line will move to the position of the new plot. |
| Keep Tool after Translation |
Specify whether to keep this tool after the translation is performed. |
| Remove |
Specify whether to remove curve translate tool from the graph. |
| Help |
Click to open the document of this tool. |
In the fly-out menu, select More Anchor... to open this dialog.
It allows you to move the anchor to a specific position by data index or value.
Note: If move anchor to a position by the specific value, the anchor just will move to the data value that is closest of the specific value.
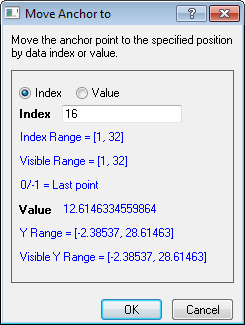
You are also allowed to enter a LabTalk expression or an expression that incorporates one of Origin's built-in statistical functions, see the details UserGuide:Reference_Lines#At_Axis_Value_2 here. Please note, when there is not a point located at the value, the anchor will be moved to the most neighboring point.
In the fly-out menu, select Step Shift to open this dialog to set the step on each translation. Each time you drag the anchor line, it is moved by the multiple of the step size which is closest to the difference X (if horizontal translate is selected) or Y (if vertical translate is selected) between the original and moved positions.
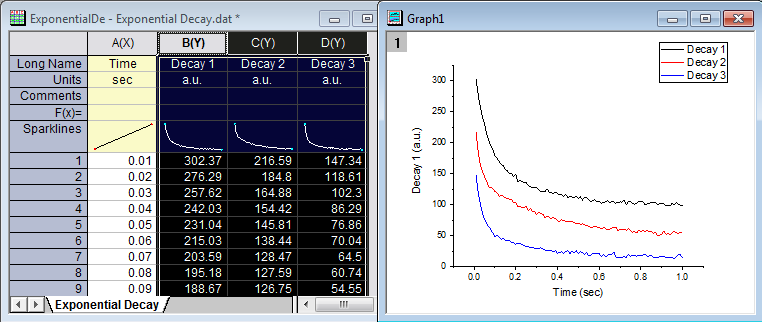
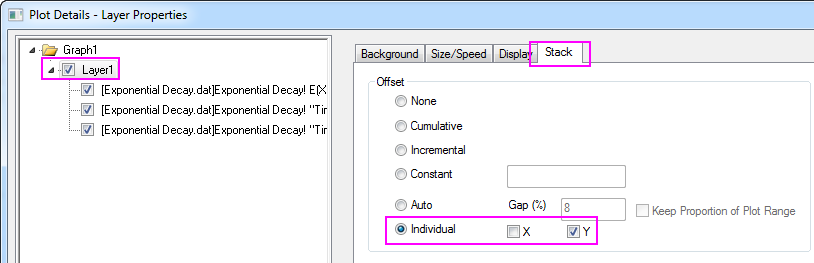
This example will show to how to move the curve vertically with two different modes: Data Update and Stack Offset. Translate the first curve with the mode Data Update and the second curve with mode Stack Offset.