When a matrix is active, you can use the Palette ![]() button and the Missing Value Color
button and the Missing Value Color ![]() button to customize color of the matrix window.
button to customize color of the matrix window.
Origin provides multiple build-in graph types for presenting NetCDF data. They are all available from the Plot menu
| Graph Type | Plot Menu Category |
|---|---|
| Contour: Contour - Color Fill, Contour - B/W Lines, Gray Scale Map | Contour |
| Image Plot | Contour |
| Surface: 3D Colormap Surface, 3D Colormap Surface with projection, 3D Color Fill Surface | 3D |
| Multiple Surface: Multiple Colormap Surfaces, Multiple Color Fill Surfaces | 3D |
Recommended Tutorials for Further Graph Customization |
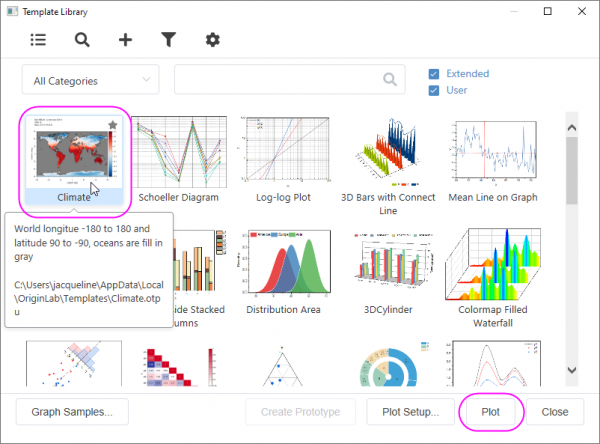
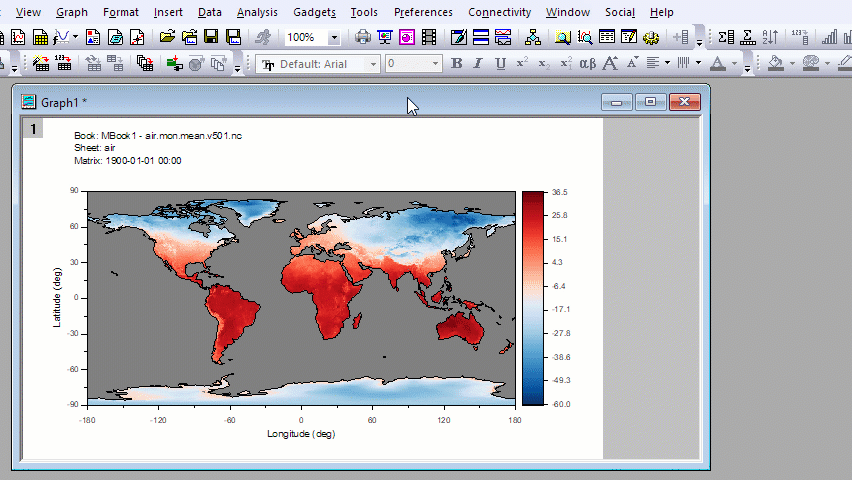
You can use the Climate template to plot the NetCDF data.
Select Plot: Template Library to open the dialog. Select Climate template and click Plot button.
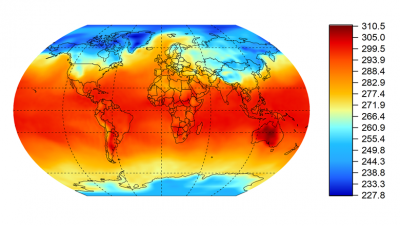
Origin supports creating contour plots in spherical surface projections. Please refer to the tutorial below for detailed steps
After creating an image or contour graph, you can click the Graph Browser ![]() button. The Browser Graph has a panel on the left-side of the window that is used to select the plots from the NetCDF matrix stack.
button. The Browser Graph has a panel on the left-side of the window that is used to select the plots from the NetCDF matrix stack.
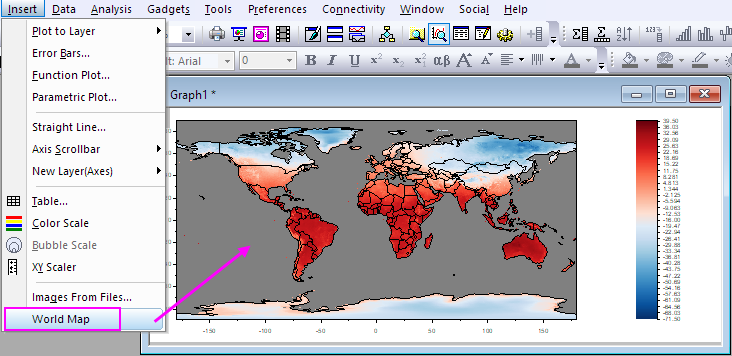
There are several ways you can add map outlines in the contour or image from NetCDF Data. You can refer to this page.