10.2 Graph with Browser Panel
Graph-Browser
Origin's Window-view Graph with Browser can be used to selectively plot datasets from a worksheet or multiple worksheets. The Browser Graph has a panel on the left-side of the window that is used to select available data (chosen randomly or by pattern), control rescale on data change, set a common display range for all plots, or remove plots.
Column Switching Browser Graph
- Activate the source worksheet and select desired columns or highlight nothing, then select Plot> Multi-Column Browser: Black Lines Browser/Color Lines Browser/Histogram Browser/Stack Lines Browser/Stack Panels Browser
Or
- Plot a general 2D graph, click the edge of the graph page, in the popup mini toolbar, click the button Column Switching Browser Graph
 to show the browser panel.
- Plot a 2D graph(contour or heatmap), click the edge of the graph page, in the popup mini toolbar, click the button Column Switching Browser Graph to show the browser panel. The matrix objects in current sheet will be listed and browsable.
Sheet/Book Switching Browser Graph
- Plot a general 2D graph, click the edge of the graph page, in the popup mini toolbar, click the button Sheet/Book Switching Browser Graph
 to show the browser panel.
- Plot a 2D graph(contour or heatmap), click the edge of the graph page, in the popup mini toolbar, click the button Sheet/Book Switching Browser Graph to show the browser panel. The matrix sheets in current matrix book will be listed and browsable.
- Note: When you plot a certain graph such as Contour+Streamline, there will be intermediate data(matrix object "u" and "v") which are created and different from source data, the Browser Panel will list the objects with same data structure of source data instead of the intermediate data objects.
Controls for Column Switching Browser Graph
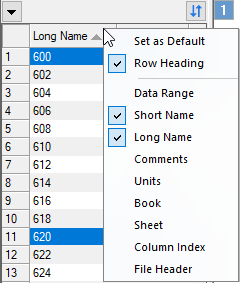
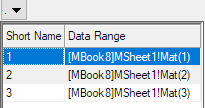
Metadata to Show in Plot List
Specify metadata to show in the plot list, including Data Range, Short Name, Long Name, Comments, Units , Book , Sheet, Column Index or File Header
- Long Name and Comment will be shown by default if not empty. Otherwise Short Name will be shown.
- When columns in the sheet are > 26 and no Long Name nor Comment exists, Column Index will be shown in place of Short Name.
- Click on any column header to reorder plots according to current data information in the ascending order or descending order.
- Right-clicking on the column header will bring up a context menu:
- Row Heading to show/hide the row index.
- Show/hide metadata column including Data Range, Short Name, Long Name, Comments, Units , Book , Sheet or Column Index
- Set as Default to set the current configuration as default. After that, you can select Remove Default to remove it.
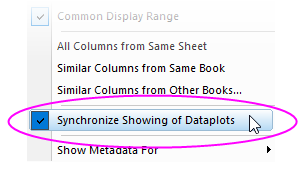
Synchronize Showing of Dataplots in Browser Stack
For a Browser Stack, the menu has an additional Synchronize Showing of Dataplots menu option that is checked by default.
-
See Plotting Multi-Panel Stacked Graph in the Browser, below, for more information.
Listing all objects in the same matrix sheet
Create a Contour or Image plot from one matrix object, show the browser panel, then all matrix objects in the same matrix sheet will be listed in the Browser panel. Click data info in the list to switch to different matrix object plot.
Browser Window Menu Controls
Click on the button  to show the Browser menu:
|
|
| For most graph type
|
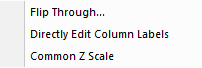
For Contour and Image Plot created from matrix
|
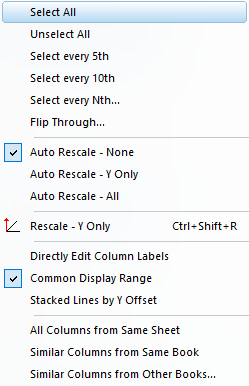
Selecting Plots and Flip Through
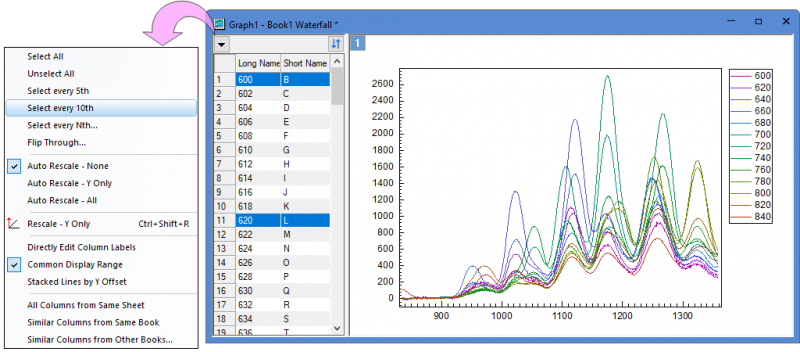
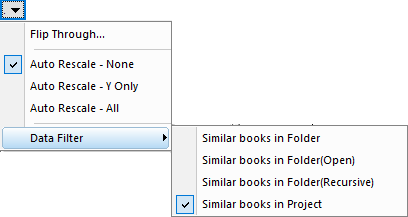
Select or unselect plots. You can select one menu item to select all plots, unselect all plots or select every Nth plot. And, you can also flip through plots with specified steps in the Flip Through dialog.
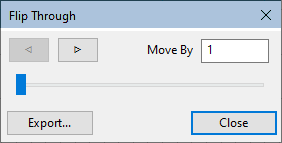
- Enter the Move By increment and click the arrow buttons (browse-forward or browse-back) to flip through plots (e.g. enter 2 and click an arrow button to view every second plot).
- Alternately, you can drag the slider to browse forward and back.
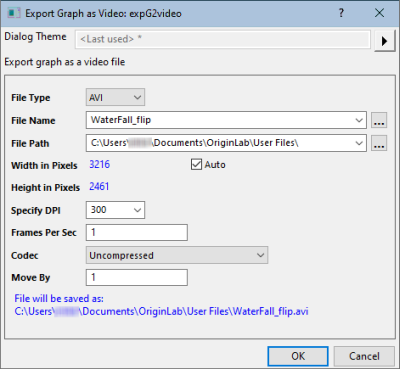
- Click Export to open the Export Graph as Video (X-Function = expG2video) dialog box and export the browser graph as video (GIF, TIFF, AVI).
Auto Rescale Mode
Specify the auto rescale mode, do not auto-rescale, only auto-rescale the Y axis or auto-rescale all axes.
Rescale - Y Only
Only rescale Y axis and keep the X scale for the layer.
Directly Edit Column Labels
Check this option to allow direct editing of column labels in the Browser panel:
- Click the menu button and place a check mark beside Directly Edit Column Labels.
- Note that if you want to add comments and you do not see that column, you need to right-click in the column heading area and place a check mark beside Comments.
- Drag column headings to reorder.
Common Display Range
Specify whether uses the smallest data range in all plots as common display range to display all data points in this range for all plots.

|
This mini tutorial will show you how the Common Display Range works:
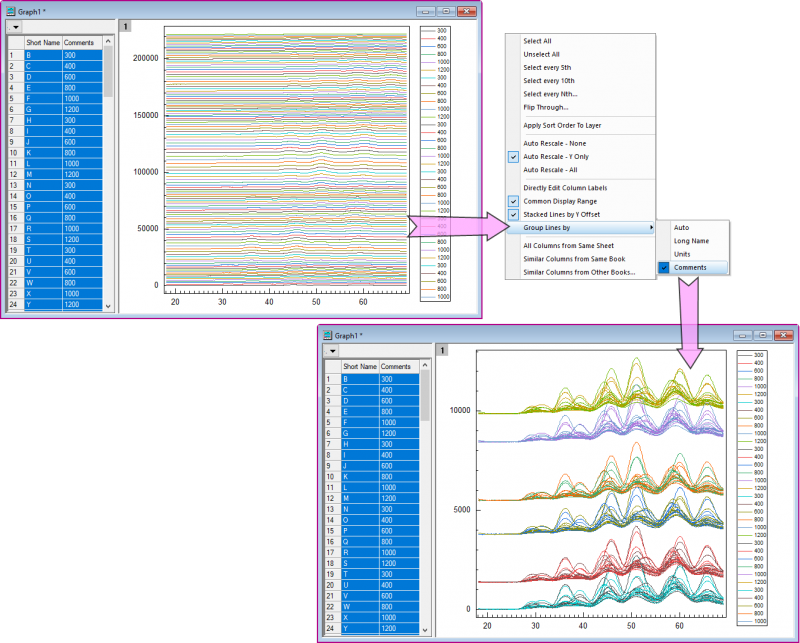
- Import the sample file "<Origin program folder>\Samples\Graphing\Waterfall.dat" into a new workbook.
- Select the first row and right-click to select "Set as Lone Name" context menu.
- Highlight all columns to select Plot> Browser: Color Lines to plot a browser graph.
- Click the arrow button at the left-top corner of the graph window to make sure the Common Display Range has been selected.
- Select the first plot "600" in the left panel and then select Data:Edit Range to set the range as below:
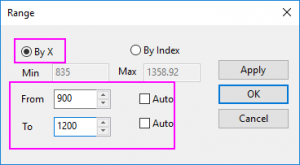
- Click other plots in the left panel, you will see the display range of all these plots have been set to the customized range above.
|
This menu item works same as the LabTalk command "layer.commonrange=1;".
Stack Lines by Y Offest
When you plot line/histogram browser, you can select this menu item to stack the selected lines by a Y offset. By default, the offset of the stacked lines is Auto as 8% of the current layer height., same as the stack lines browser plotted from Plot> Multi-Column Browser: Stack Lines Browser menu.
Group Lines by
Once you checked Stack Lines by Y Offset, a drop-down list Group Lines by will appear to let you decide whether to subgroup the lines with the column lable rows and then stack the lines by subgroups.
Once you've checked one column label row for this list(not Auto), the Offset Between Subgroup (in Group tab) for Constant/Auto in Stack tab of Plot Details will be checked, and this column label row will be selected under the Subgrouping group as subgrouping information in Group tab of Plot Details.
Adding More Columns
Once you were browsing the plots, you can decide to add more relative columns into the first layer of graph in the browser:
- All Columns from Same Sheet: Add all columns in current worksheet into current graph layer; for stack graph, the columns will be added into layer 1 of the graph
- Similar Columns from Same Book: Add the similar columns from the same workbook into current graph layer; for stack graph, the columns will be added into layer 1 of the graph
- Similar Columns from Other Books: Add the similar columns from other selected workbook into current graph layer; for stack graph, the columns will be added into layer 1 of the graph
Changing Source Worksheet
When all listed columns in the browser panel are from same worksheet, you can select Change Worksheet : <worksheet name> to change source data of current graph to another worksheet with same data structure.
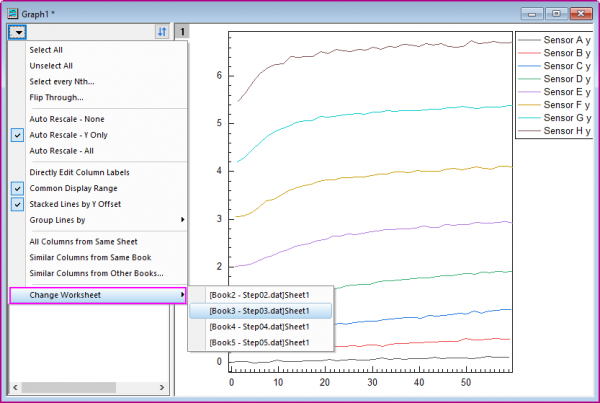
All matching worksheets with same data structure will be listed under the Change Worksheet context menu.
Common Z Range
This option is only for Contour and Image Plot created from matrix.
Creating a new Contour or Image graph, this option is checked by default. And the plots will use the minimum and maximum Z value of all plots as From and To for colormap level.
Rescale Z range
- Check this option
- Active any plot in the plot list in left panel and click the Rescale button, the plots in the graph will use the minimum and maximum Z value of all plots as From and To for colormap level.
- Uncheck this option
- Active a plot in the plot list in left panel and click the Rescale button, the plots in the graph will use the minimum and maximum Z value of active plot as From and To for colormap level.
Auto Apply Sort Order to Layer button
Click the Auto Apply Sort Order to Layer button  to auto apply the sort order from left browser panel to the plots in current layer.
If you want to turn off the auto apply, you can click the button  to trun off the auto apply for sorting the plot order.
Panel Shortcut Menu
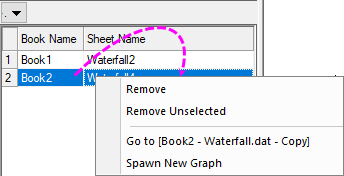
Right-click in the panel to produce a shortcut menu:
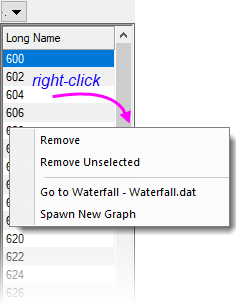
- Remove: Removes the selected plot(s).
- Remove Unselected: Removes all but selected plot(s).
- Go to ...: Go to the worksheet and select source column(s).
- Spawn New Graph: Create a new graph window of just the selected plot(s).
 | Choosing Go to ... activates source data for your current Browser plot(s). To isolate that data, (a) right-click in the column label row area of one of the selected worksheet columns and choose Copy (including label rows), (b) go to a fresh worksheet and select the entire sheet by clicking in the blank cell at the intersection of column and row labels, (c) then paste.
|
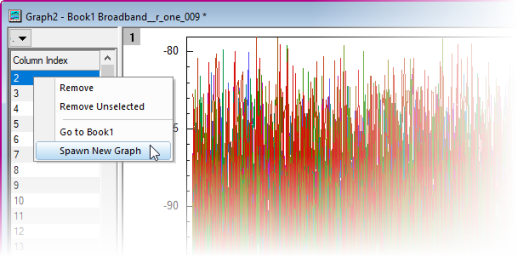
Spawn New Graph
Use this to plot the current Browser selection(s) as a separate graph window in Window View Mode:
- Right-click on your plot selection in the Browser panel.
- Choose Spawn New Graph.
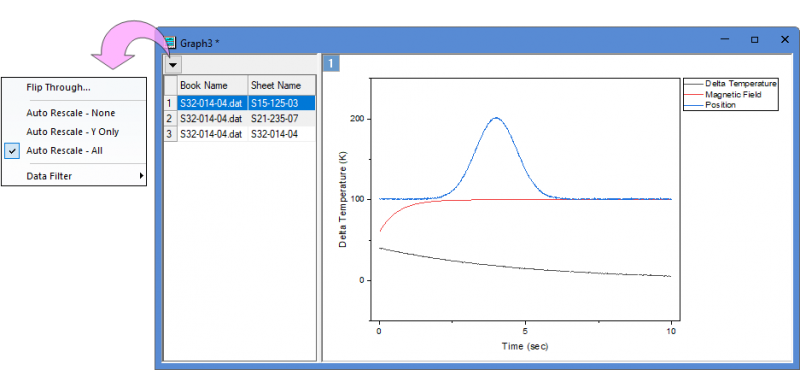
Controls for Sheet/Book Switching Browser Graph
Once you have enabled Sheet/Book Switching Browser with LabTalk command or Mini toolbar,
- if the data columns of graph are from a same sheet, then the browser panel will list all sheets that have same structure, same as batch plotting with sheet(Match columns by column index, match modifier by offset).
- if the data columns of graph are from same book, the browser panel will list all books that have same structure, same as batch plotting with book(Match columns by column index, match modifier by offset, match sheet by index).
In this mode, the browser panel woth sheet/book list only support single selection.
Browser Window Menu Controls
Click on the button to show the Browser menu:
|
|
| For Sheet Switching
|
For Book Switching
|
Metadata to Show in Sheet/Book List
Right-click on the column header of panel list to select show what metadata in the sheet/book list:
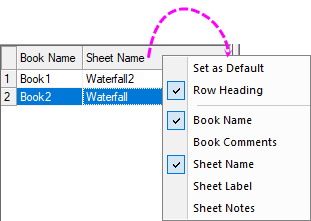
- Set as Default: 3 default settings for listing sheet/book. To list sheets, you should select sheet name; To list books, you should select book name by default.
- Row Heading: Select Row Heading to show the row index as row header for the plots.
- Book Name: Show book short name.
- Book Comments:Comments in the Workbook Window Properties dialog.
- Sheet Name: Show Sheet Name stored in the Name an Notes dialog.
- Sheet Label: Sheet Label stored in the Name an Notes dialog.
- Sheet Notes:Sheet Notes stored in the Name an Notes dialog.
Panel Shortcut Menu for Sheets/Books
Right-click on a sheet/book list row, a short-cut menu will appear:
About how these menu items work, you can refer to the short-cut menu of Column Swicthing Browser.
Plotting Multi-Panel Stacked Graph in the Browser
Since Origin 2021, Origin supports to plot stacked multi-panel graph with the browser panel:
- Select Plot> Multi-Column Browser: Stack Panels Browser... menu to open the Stack:plotstackbrowser dialog.
- Select a column label row as Group By, and select Bstack as Graph Template; set the gap between the layers and margin around the panels.
- Click OK button to plot the stacked graph.
| You can specify a custom template to plot your Browser Stack graph. See Notes on this page for more information.
|
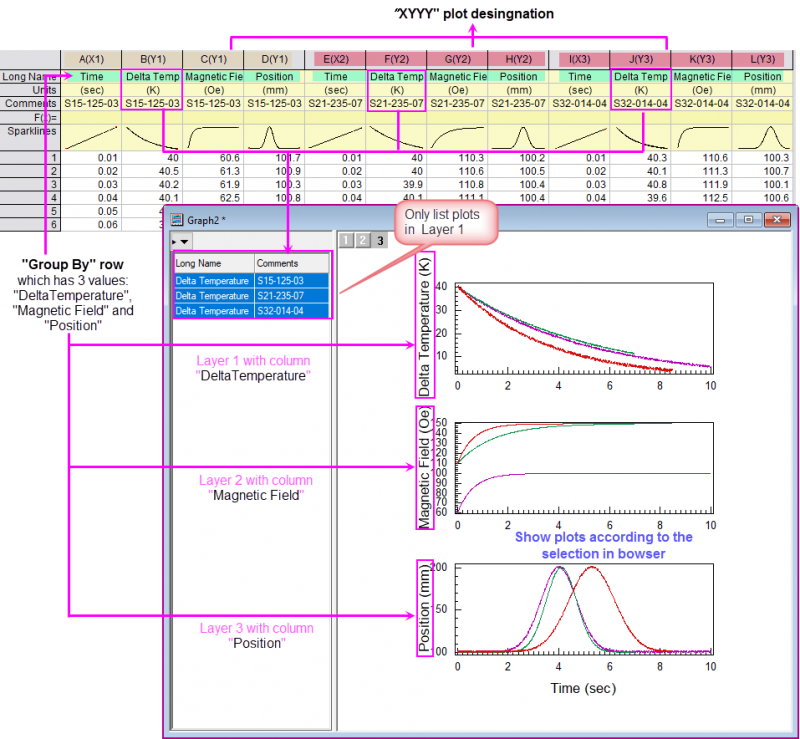
Once the stacked graph has been plotted, if the Group By row has N values, there will be N layers stacked in the graph. All Y columns grouped by the first grouping value will be plotted into the first panel and the other columns with same grouping value will be plotted into one graph layer according to the grouping values one by one.
In the Browser panel, all columns plotted in layer 1 will be listed there row by row,
- By default, the Plot Details Show/Hide Plots with Same control has been set to Index. That means when you selected one or more columns at once, the other Y columns with same plot index in the other layers will show up.
- If you set the Plot Details Show/Hide Plots with Same control to Name, when selected one or more columns at once, the other Y columns with same name(grouping value) in the other layers will show up .
General Operations on Graph/Layer/Plots
All graphing operations can be performed on the displaying plot(s) in the right graph panel, including customize the axes in the Axis dialog, set the plot styles for the plot(s) and do settings on the layer and graph level in the Plot Details dialog. And, the mini toolbars are also available for this kind of graph.
And, just like the general graphs, you can open the analysis dialogs/tools to perform further data exploration.
Two things need be noted are
- Once you done plot selection in the left panel, the Plot Details dialog will persisted the selection in the left panel tree.
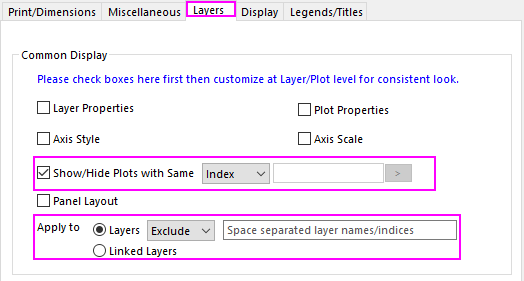
- When you plotted a stack graph with browser panel, in the page-level Layers tab of Plot Details dialog,
- the Show/Hide Plots with Same control will be set to Index by default, which means when you select any plot in the browser panel, all plots in different layers but with same index will show up.
- the Layers radio box of the Apply to control will be selected and Exclude will be selected from the accompanying drop-down list. If desired, you can enter a layer number to exclude the layer when applying the common display settings above.
- The Object Manager will only show the graph and layer tree nodes, hide all plots.
Synchronize Showing of Dataplots
These controls can be used to manipulate plot display.
-
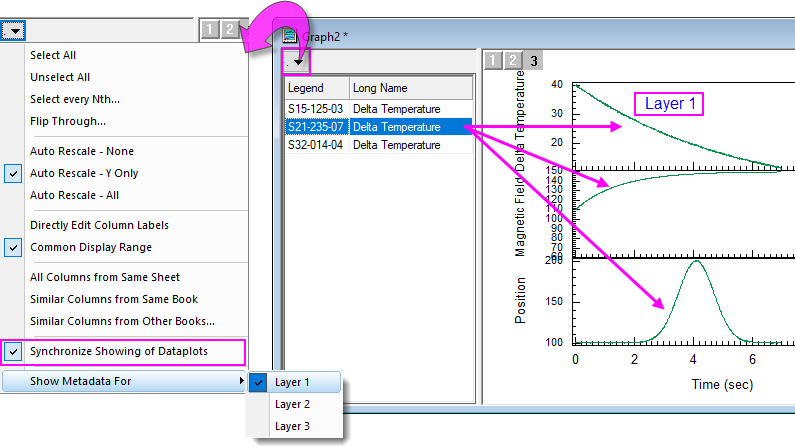
- When Synchronize... is checked, a Show Metadata For flyout menu is added. Use the flyout to pick a layer; then by right-clicking on the browser panel header, choose the column label row info (metadata) to display. You can then click a row in the plot list to plot that dataset along with associated plots in other layers. In the example above, Delta Temperature is plotted in Layer 1, hence that is the metadata that shows in the browser panel list.
-
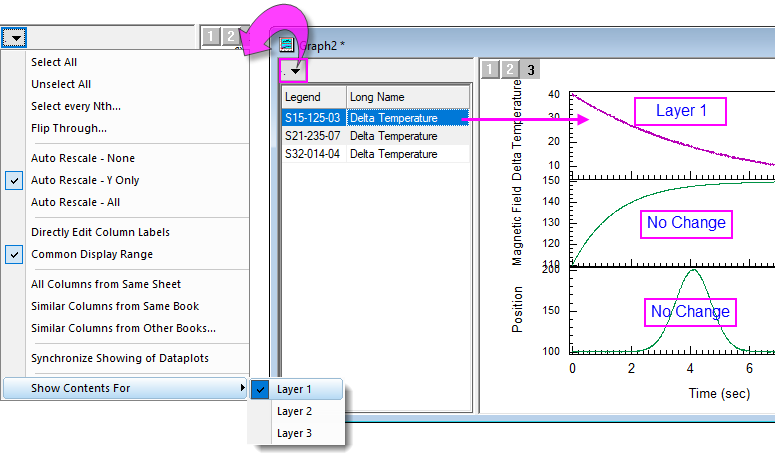
- Clearing Synchronize... will allow you to change plots in only the selected layer without affecting plots in other layers. In the example above, we have chosen to Show Contents For only Layer 1 (i.e. when we select a different Delta Temperature dataset in the browser panel list, the plots in Layer 2 and Layer 3 do not change.
Show Graph Browser by Mini Toolbar
Column Switching Browser
Use Column Switching Browser Graph button in the Mini Toolbar for Graph page to show the brower.
Sheet/Book Switching Browser
Use Sheet/Book Switching Browser Graph button in the Mini Toolbar for Graph page to show the brower.