Print View is the WYSIWYG (What You See is What You Get) view mode. Font information is received directly from the printer driver, so that Print View displays a page that, in most cases, is exactly the page that is produced by your hard copy device. On-screen image quality may suffer slightly, as the printer driver fonts must be scaled to fit their positions on the page (this will not harm the appearance of true vector fonts).
Print View may be slow on some systems. If you find that window redraw times are excessive, consider using Print View mode only to preview your work prior to printing.
To display the active graph window in the Print View mode, do one of the following:
- Right-click in the graph window but outside the page and select Print View from the shortcut menu.
or
- Select Format: Page to open the page's Plot Details dialog box.
- Select the Miscellaneous tab and select Print View from the View Mode drop-down list.
(default)
Page View provides faster screen redrawing than Print View, but does not guarantee exact text placement on the screen unless you are using a typeface scaling software (such as Adobe Type Manager).
If Print View mode is too slow, you could use Page View mode until you have your graph ready for printing or exporting. Then, switch to Print View mode to do a final check of object placement.
To display the active graph window in the Page View mode:
- Select Format: Page to open the page's Plot Details dialog box.
- Select the Miscellaneous tab, then select Page View from the View Mode drop-down list.
Window View expands the page to fill up the entire graph window. Labels, buttons, or other objects that might reside in the gray area off the graph page are not visible in Window View mode.
Beginning with Origin 2018b, Window View was changed from a rough "view-only" mode in which text (including tick labels) was distorted, to an exportable view of the graph in which text is preserved. This mode is intended primarily for inspection of plots when it would be advantageous to see the plot "stretched" in the X or Y dimension. Stretch the plot by dragging the window frame with your mouse.
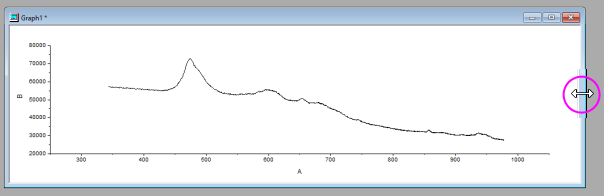
Note: Unlike earlier versions, stretching the window in Window View mode now changes the page dimensions and you cannot simply restore page dimensions by re-selecting Page View. Page dimensions have to be manually reset; or you can close Plot Details and use Edit: Undo Modify Page to undo changes to page dimensions (but other changes made via Plot Details will also be lost). "Best practice" is to reserve Window View for situations where you want to stretch a plot in one dimension to facilitate exploratory analysis. Note that the graph Preview image that appears in many of Origin's analysis dialog boxes is drawn in Window View.
To display the active graph window in the Window View mode:
- Select Format: Page to open the page's Plot Details dialog box.
- Select the Miscellaneous tab and select Window View from the View Mode drop-down list.
Draft View produces the fastest screen redraw times. In Draft View, the page is automatically resized to fill the graph window. This is a convenient mode to use when you are primarily interested in looking at data on your screen.
To display the active graph window in the Draft View mode:
- Select Format: Page to open the page's Plot Details dialog box.
- Select the Miscellaneous tab and select Draft View from the View Mode drop-down list.
Page rotation is disabled in Draft View. Additionally, text rotation and text formatting (e.g. superscript, subscript, Greek symbols, and text styles and fonts) are not visible in Draft View. All text displays in the system font only. To view text rotation and formatting, switch to Page View or Print View.