| |
|
|
|
|
| |
|
|
|
|
Select at least one Y columns of values (or a range from at least one columns). If there is an associated X column, X column supplies X values; otherwise, sampling interval of the Y column or row number is used.
Select required data.
From the menu,select .
When you select Plot > Multi-Column Browser: Stack Panels Browser... menu to plot a stacked browser graph, a dialog "Stack:plotstackbrowser" will be opened:

This X-Function is similar with the X-Function plotstack. In this dialog,
BBLINE.OTP; BCLine.OTP; BHISTO.OTPU; BSLine.otpu; BStack.otpu (installed to the Origin program folder).
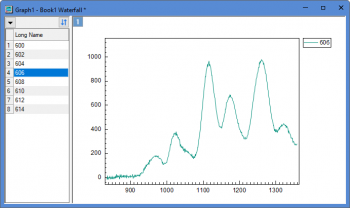
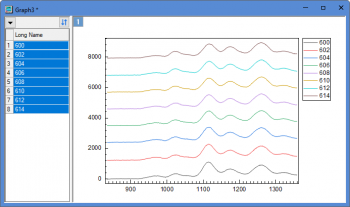
The "stack lines" browser graph plots all selected coumns as a stack lines by specified Y offset. By default, the Offset is set to Auto and Gap(%) is 8 at the Stack tab of Plot Details dialog. Each displayed curve will be stacked with same offest gap from the previous displayed curve.
Note: For the browser graph with black lines or color lines, you can click the down arrow button to select Stack lines by Y Offsets context menu to switch lines to stack lines, vice versa.
The BStack template can be customized and saved to the User Files Folder and made to list in the Graph Template drop-down of plotstackbrowser by doing the following:
page.tkey$=GBStack
For more detailed information, please refer to the page "Graph With Browser Panel".