6.14 Windrose Graph
Windrose-Graph
Summary
Windrose graphs are used to present wind speed data and wind direction data collected over time at a particular location. This tutorial will demonstrate how to create windrose graphs from both raw and indexed data:

What will you learn
This tutorial will show you how to:
- Create a windrose graph from binned data
- Customize the direction tick labels on the windrose graph
- Create a windrose graph from raw data
Steps
This tutorial is associated with <Origin EXE Folder>\Samples\Tutorial Data.opj.
Also, you can refer to this graph in Learning Center. (Select Help: Learning Center menu or press F11 key , and then open Graph Sample: Specialized Graphs)
Part 1: Create a Windrose Graph from Binned Data
- Open Tutorial Data.opj and browse to the Wind Rose folder in Project Explorer (PE).
(If you don't have the project file, please import the sample data from here).
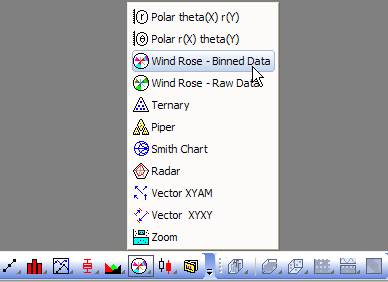
- Activate the Book6E workbook. Highlight all worksheet columns and click the Wind Rose - Binned Data button on the 2D Graphs toolbar as shown below or select Plot: Specialized: Wind Rose-Binned Data from the main menu.
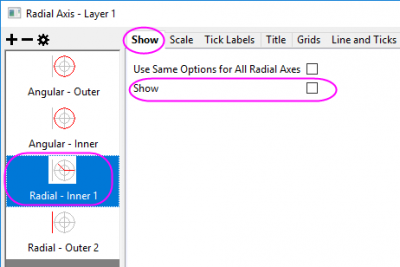
- Double-click on the radial axis on the polar to open the Axis dialog. With Radial - Inner 1 selected, go to Show tab, uncheck Show check box to turn off the inner radial axis.
Select Radial - Outer 2 in the left panel, check Show check box to turn on the outer axis.
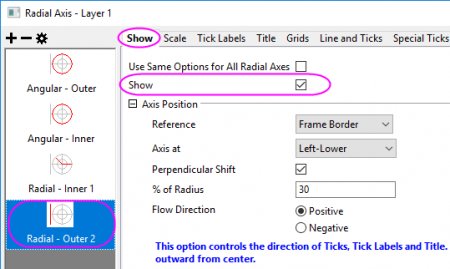
Click OK button to just show the radial axis at left-lower position.

- Click on any bar in the graph, and in the popup mini toolbar, click the Fill Color button
 under the Group tab
  to expand the Color Chooser. In the Color Chooser, under the By Plots sub-tab, select or click the color list or color palette in the you desired to apply the bar colors.

- Click on the Text Tool button
 to add a Text object as graph title. And enter Sample of Wind Rose (Binned Data) in that Text object.

Part 2: Create a Windrose from Raw Data
- Go to the project folder Statistical and Specialized Graphs: Specialized: Wind Rose and activate the Book7E workbook, Raw Data worksheet. (If you don't have the project file, please import the sample data from here).
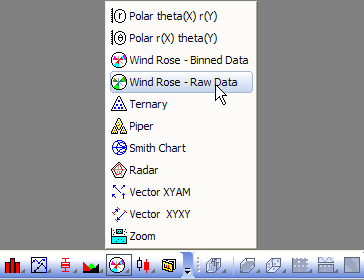
- Highlight columns A & B. Click the Wind Rose - Raw Data button on the 2D Graphs toolbar as shown below or select Plot: Specialized: WindRose - Raw Data from the main menu.
In the dialog opened, do the settings below and click OK button to create the wind rose graph:

- Do the same operations as the step 3 in the Part 1 to move the radial axis to the left-bottom. And, go to Tick Labels tab for Radial Outer 2 to remove the Suffix "%" for the radial axis tick labels.
- Do the same operations as the step 4 in the Part 1 to change the fill color for the stacked bars.
The final graph should resemble the image shown below:

Sample Data
Binned Data
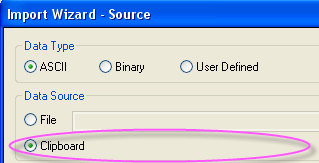
To import Binned Data to a worksheet, copy the Binned Data 1 (including the heading) and select File: Import Wizard. Select the Clipboard checkbox in the DataSource group and click the Finish button to import the data into Origin.
| Direction
|
0-4
|
4-8
|
8-12
|
12-16
|
16-20
|
| 22.5
|
3.125
|
3.125
|
3.125
|
6.25
|
0
|
| 45
|
0
|
3.125
|
3.125
|
0
|
0
|
| 67.5
|
0
|
6.25
|
0
|
0
|
0
|
| 90
|
0
|
0
|
0
|
0
|
3.125
|
| 112.5
|
0
|
0
|
0
|
0
|
0
|
| 135
|
3.125
|
0
|
0
|
0
|
3.125
|
| 157.5
|
0
|
0
|
9.375
|
3.125
|
0
|
| 180
|
3.125
|
3.125
|
0
|
3.125
|
3.125
|
| 202.5
|
0
|
0
|
0
|
0
|
0
|
| 225
|
0
|
0
|
3.125
|
0
|
0
|
| 247.5
|
0
|
3.125
|
0
|
3.125
|
3.125
|
| 270
|
0
|
0
|
0
|
0
|
3.125
|
| 292.5
|
0
|
6.25
|
3.125
|
0
|
0
|
| 315
|
0
|
0
|
3.125
|
3.125
|
0
|
| 337.5
|
0
|
0
|
0
|
0
|
0
|
| 360
|
0
|
6.25
|
0
|
0
|
0
|
| 382.5
|
0
|
0
|
0
|
0
|
0
|
Raw Data
To import Raw Data to worksheet, you can copy the Raw Data (including the heading) and then select File: Import Wizard. Select the Clipboard checkbox in DataSource group and then click Finish button to import the data into Origin.
| Direction
|
Speed
|
| 311.5
|
12.75
|
| 142.7
|
11.18
|
| 161.6
|
5.9
|
| 277.3
|
8.24
|
| 155.3
|
13.46
|
| 40.8
|
8.57
|
| 43.4
|
4.38
|
| 1.3
|
10.91
|
| 78.8
|
18.72
|
| 237.8
|
16.22
|
| 114.6
|
0.88
|
| 2.1
|
12.05
|
| 290.5
|
4.6
|
| 174.1
|
3.29
|
| 267.6
|
16.64
|
| 8
|
5.6
|
| 213.9
|
8.04
|
| 134.8
|
17.26
|
| 137.6
|
11.87
|
| 46.1
|
5.48
|
| 4.5
|
13.47
|
| 311.2
|
10.17
|
| 154.4
|
11.17
|
| 176.2
|
18.91
|
| 348.1
|
4.11
|
| 225.2
|
6.65
|
| 236.4
|
12.87
|
| 11.7
|
1.07
|
| 278.9
|
4.36
|
| 356.5
|
5.01
|
| 58.9
|
7.3
|
| 161.8
|
15.6
|