提示:此部分只提供英文原文,敬请谅解!
6.7.3 Stack Lines by Y Offsets
Contents

|

|
Summary
This tutorial will demonstrate how to create a graph with stack lines by Y offsets.

Minimum Origin Version Required: Origin 2015 SR0
Aside from the stacked individual line plots described in this tutorial, you can create stacked line plots comprised of sub-groups of lines, with offsets created between sub-groups. See the Plot Details Stack tab for details. |
What you will learn
- How to create a graph with stack lines by Y offsets
- How to customize a rectangular object
- How to add a new XY scaler
Steps
This tutorial is associated with the Tutorial Data project:<Origin EXE Folder>\Samples\Tutorial Data.opj.
Create a Stack Line Plot
- Open the Tutorial Data project and browse to folder Stack Lines by Y Offsets in Project Explorer.
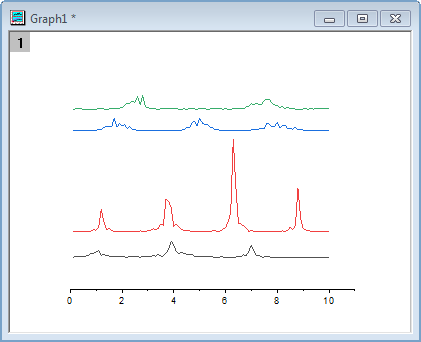
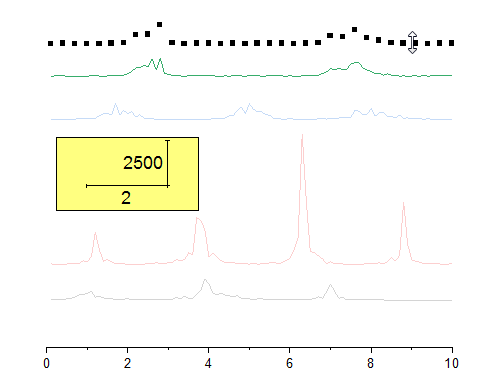
- Highlight all the columns in the data worksheet of Book6A, and choose menu Plot > Basic 2D : Stacked Lines by Y Offsets to create a graph with stack lines by Y offsets.
Customize the Stack Line Plot
- Delete the following objects by selecting them and pressing the Delete key on your keyboard:
- Legend
- Y axis
- Y axis labels
- Y axis title
- X axis title
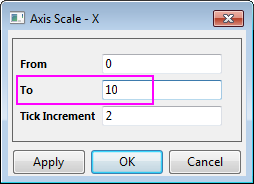
- Click on the X axis, and select Axis Scale button
 in the Mini Toolbar to open the Axis Scale - X dialog. Set To value to 10. Click OK to close the dialog.
Add XY Scaler
- Click the Rectangle button on the Tools toolbar and then create a rectangle on the graph.
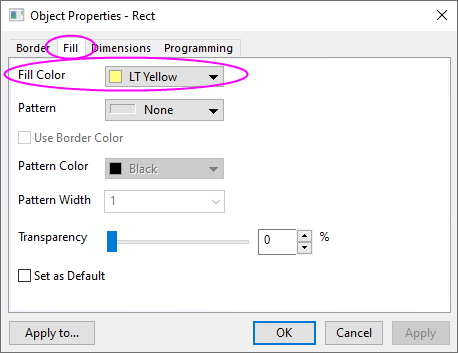
- Double click on the rectangle to open its properties dialog. Change the following settings.
- Fill tab
- Fill Color = LT Yellow
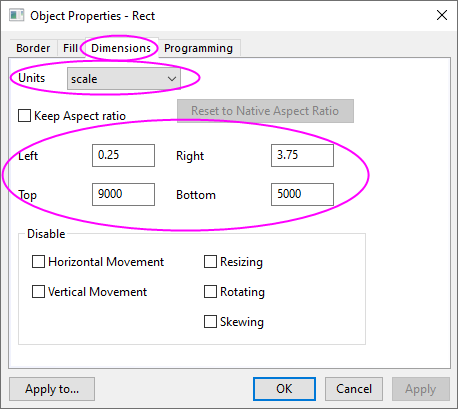
- Dimensions tab
- Units = scale
- Left = 0.25
- Top = 9000
- Right = 3.75
- Bottom = 5000
- Fill tab
- Click OK to close the Object Properties dialog.
- Select Insert:XY Scaler from the Origin menu to create a new XY scaler.
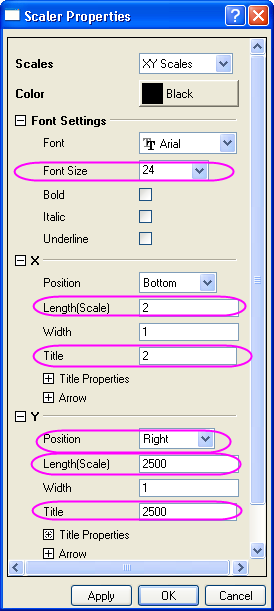
- Double click on the scaler to open the Scaler Properties dialog. Set the following properties in the dialog:
- Font Settings branch
- Font Size = 24
- X branch
- Length(Scale) = 2
- Title = 2
- Y branch
- Position = Right
- Length(Scale) = 2500
- Title = 2500
- Font Settings branch
- Click OK to close the Scaler Properties dialog.
- Move the scaler object onto the rectangle you created.
Drag and Change Plot Offset
- Click once on the top data plot to select it.
- Drag with the mouse to move the data plot.
- Note: an alternative is to go to the Offset tab in Plot Details dialog and change the Y offset.
