提示:此部分只提供英文原文,敬请谅解!
6.7.1 Double Y Graph
Contents

|

|
Summary
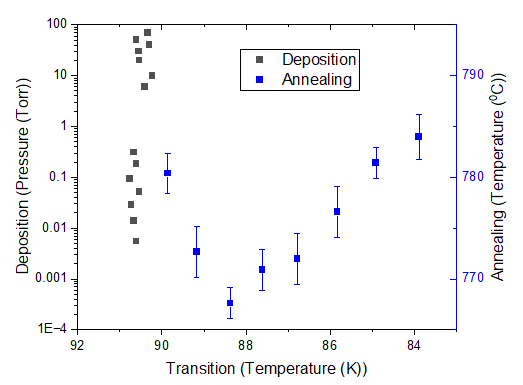
This tutorial will show how to create a graph with double Y axes in only one layer.
Minimum Origin Version Required: Origin 2023
What you will learn
- Create a graph with double Y axes
- Customize scatter plots
- Change axis scale
Steps
This tutorial is associated with the project: \Samples\Graphing\Double-Y.opj.
Method 1: Using Built-in Double-Y Template
- Open the project <Origin Installation Directory>\Samples\Graphing\Double-Y.opj and activate the workbook.
- Highlight four columns of data in the worksheet, then choose menu Plot > Multi-Panel/Axis : Double-Y to create a graph with double Y axes.
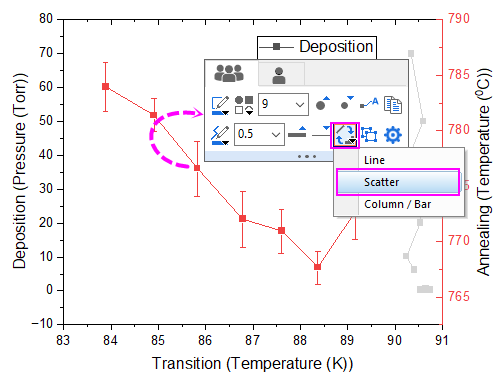
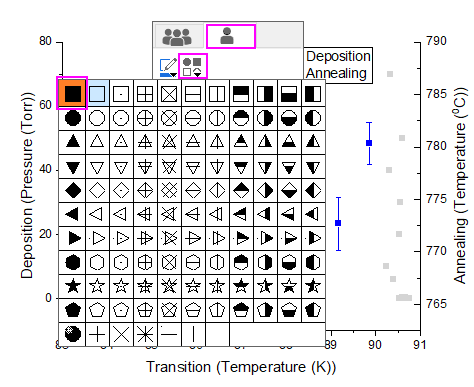
- Click on the plot, in the popup mini toolbar, click the button Change Plot to to select Scatter to change the plot type for all the plots.
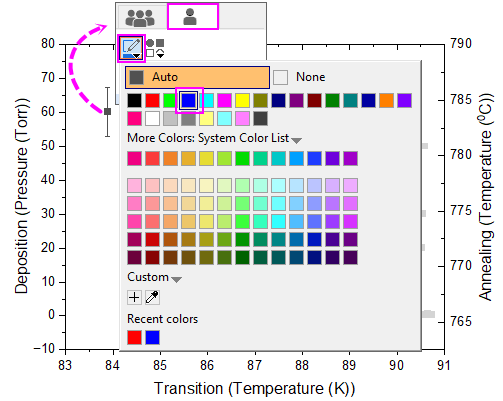
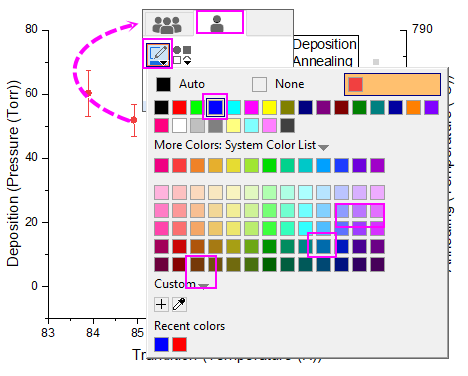
- Click on one scatter point of second plot, in the popup mini tolbar, switch to the Single Plot tab and set the color to Blue.
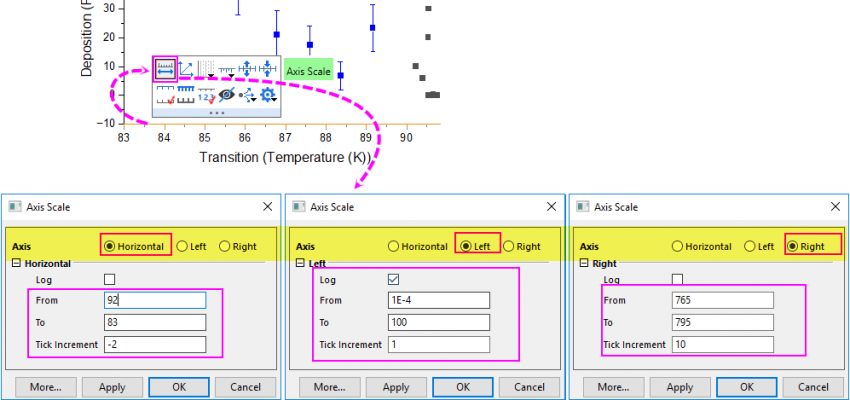
- Click on bottom X axis, in the popup mini toolbar, click the button Axis Scale to open the Axis Scale dialog to set the axis scale for Bottom X, Left Y and Right Y.
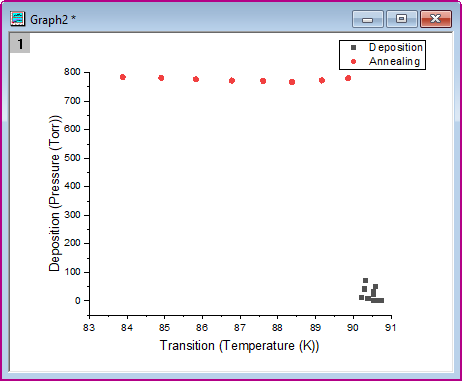
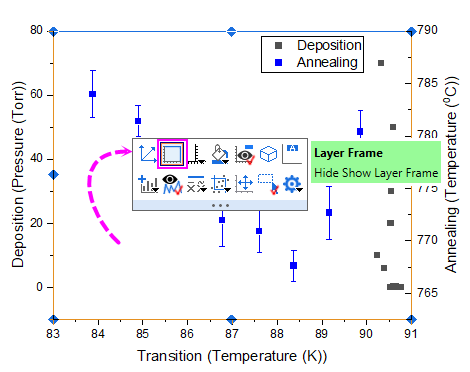
- You will get the final graph as below:
Method 2: Adding Right Y to the Graph with Left Y
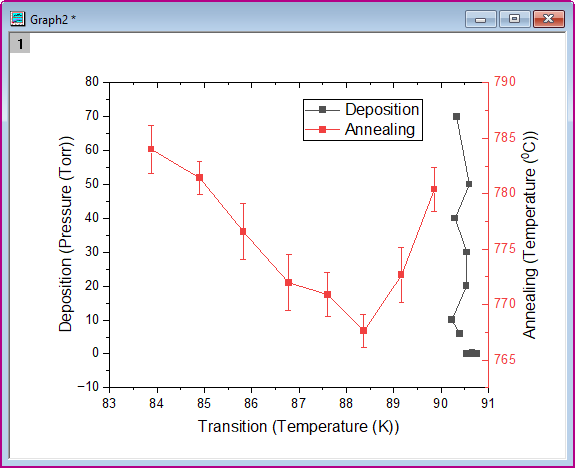
- Highlight four columns of data in the worksheet, then choose menu Plot > Basic 2D : Scatter to create a scatter graph.
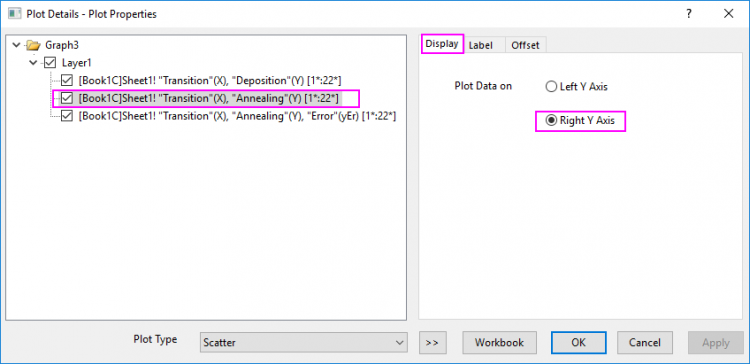
- Double-click on the scatter to open the Plot Details dialog. Select seond plot in the left panel and go to Display tab and select Right Y Axis to make this plot against the right Y axis. Note: You can also use the Object Manager to assign a plot to a right Y axis as outlined here.
- Click on the second plot, in the popup mini toolbar, change the symbol color to Blue. And change the symbol shape to Square.
- Click on the white spcae of current layer to add layer frame from the mini toolbar.
- Set the axis scale just like what we do in the Step 5 of Method 1.
- You will get the same graph as that in Method 1.
| Note: This kind of double-Y graph only has one graph layer, which is different from the 2Ys graph.
For the versions earlier than Origin 2023, Origin doesn't support two different axis scales for right Y and left Y in same layer simultaneously, so you have to plot the 2Ys graph to implement this graph. |