4.1.8 Quick Peaks Gadget
Quick-Peak-Gadget
Summary
The Quick Peaks gadget can be used to pick peaks, subtract baseline, integrate the peaks and/or fit peaks in a ROI (Region of Interest). It is also possible to use this tool in combination with the Peak Analyzer. Please refer to this tutorial for details.
Minimum Origin Version Required: Origin 2015 SR1
What you will learn
This tutorial will show you how to:
- Find and subtract baseline for spectrum with the Quick Peaks gadget.
- Find peaks on the graph with the Quick Peaks gadget.
- Customize preference settings.
Steps
- Create a new workbook by clicking the New Workbook button
 . Select Help: Open Folder: Sample Folder... to open the "Samples" folder. In this folder, open the Spectroscopy subfolder and find the file Zircon.dat. Drag-and-drop this file into the empty worksheet to import it.
- Highlight Col(B) and plot a line graph with the Line
 button on the 2D Graphs Toolbar.
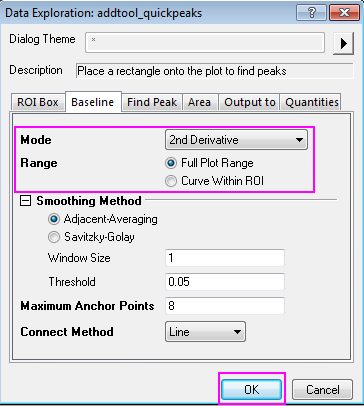
- Select Gadgets: Quick Peaks from the main menu to open the Quick Peaks: addtool_quickpeaks dialog.
- On the Baseline tab, set Mode to 2D Derivative, and then set Range to Full Plot Range. Click OK to apply.
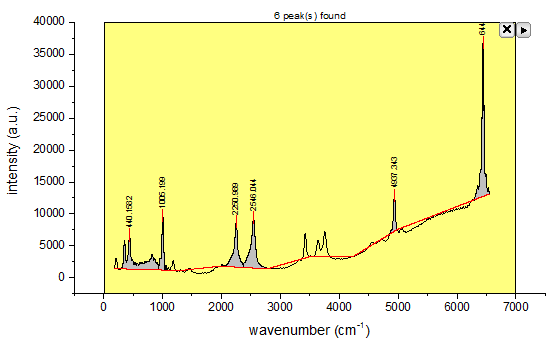
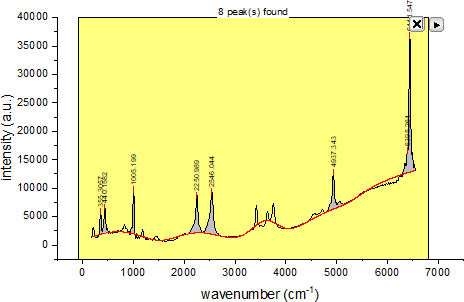
- The peaks within the yellow ROI box will be found and marked. Resize the ROI box so that it covers X range[0,7000] as shown in graph below, the baseline and peak finding need a further refinement.
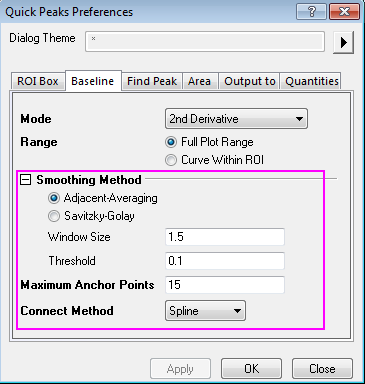
- Click the triangle button
 and select Preference from the fly-out menu, so you can further adjust the Smoothing Method in Baseline tab follows the graph:
click Apply to apply, and further adjust the values in Find Peak tab:
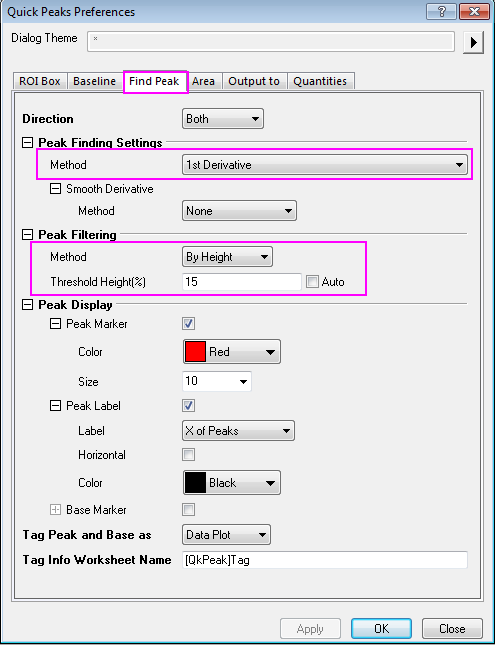
- Click OK to apply the settings and close the dialog, the baseline and peaks finding are better than before which can be attribute to the optimizing Threshold and Maximum Anchor Points for Baseline and Threshold Height% for Find peak:
- Click the triangle button and select New Output to generate the peak finding results to a report worksheet.
Click the triangle button again and select Go to Report Worksheet to view the quantities output:

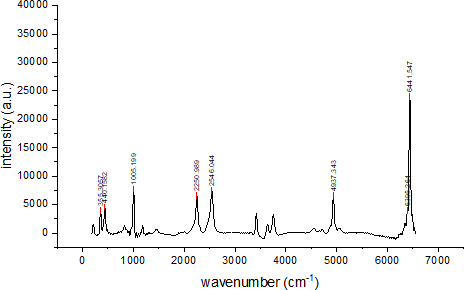
- Activate the graph window to which the gadget was applied, click the triangle button and select Subtract Baseline, click OK for pop-up window, the baseline was subtract from the data.
- Note: Check the worksheet after subtracting the baseline, if nothing happens, it's because the data is imported by the connect. In this case you need to click the green icon
 in the upper left hand corner of the worksheet, and click Unlock Imported Data or Remove Data Connector.... Then subtract baseline again.
- Click X button on the top right corner to close the gadget. The finished graph is shown like this:
Note: For advanced fitting options, you can combine Quick Peaks gadget with Peak Analyzer.