4.4.4 Combine Quick Peaks Gadget with Peak Analyzer
Combine-QuickPeakGadget-PA
Summary
The Quick Peaks gadget provides an intuitive way to carry out peak analysis, and Peak Analyzer provides further options for peak finding, fitting, etc. You can first use Quick Peaks gadget to find peaks and then use the Peak Analyzer to analyze the peaks. You can save the whole analysis as a theme in the Peak Analyzer for future use and/or batch processing.
Minimum Origin Version Required: OriginPro 9.0 SR0
What You Will Learn
This tutorial will show you how to:
- Use the Quick Peaks gadget to find peaks.
- Open the Peak Analyzer from Quick Peaks gadget.
- Further analyze the peaks found in Quick Peaks gadget using the Peak Analyzer.
Steps
This tutorial is associated with <Origin EXE Folder>\Samples\Tutorial Data.opj.
- Open Tutorial Data.opj and browse to the Quick Peaks Gadget folder in Project Explorer (PE).
- Highlight all columns in the Nitrate worksheet and click the
 button on 2D Graph toolbar to generate a line graph.
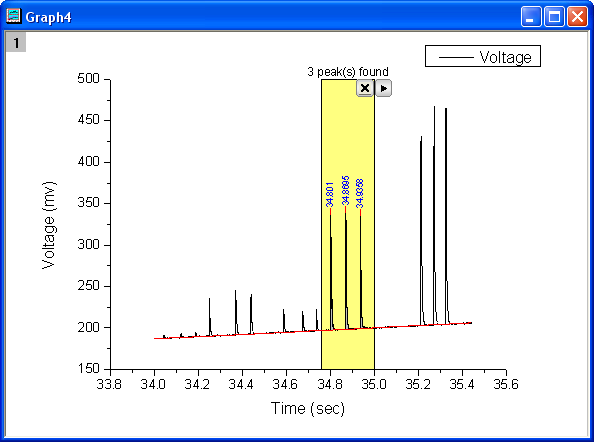
- Activate the generated graph window and select Gadgets:Quick Peaks.
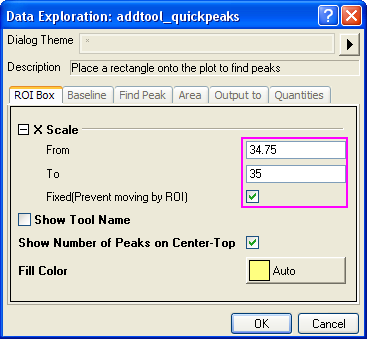
- In the ROI box tab, change the From and To values of X scale to 34.75 and 35 respectively, select the Fixed(Prevent moving by ROI) check box.
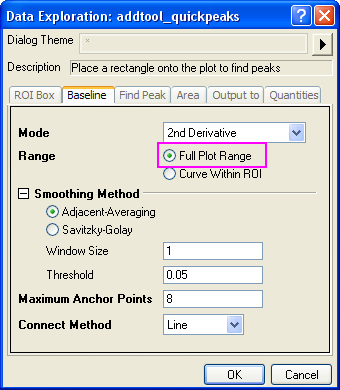
- In the Baseline tab, select the Full Plot Range radio button for Range.
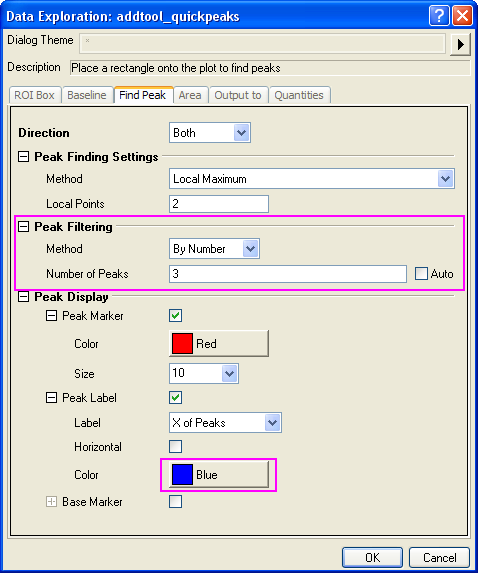
- In the Find Peak tab, change the Method for Peak Filtering to By Number, and set the Number of Peaks as 3, select Blue as the color of the Peak Label.
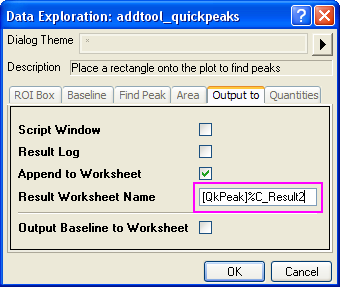
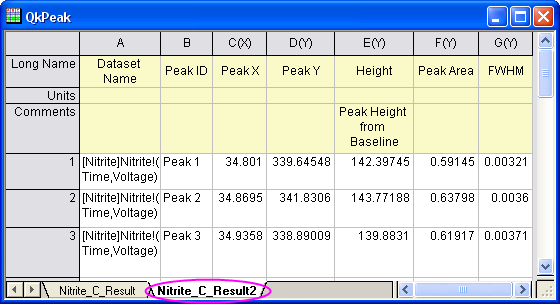
- In the Output to tab, change the Result Worksheet Name to [QkPeak]%C_Result2.
- In the Quantities tab, you can decide which quantities to output. Leave only the check boxes for Peak ID, Peak X, Peak Y, Height, Peak Area and FWHM checked, and clear the other check boxes. Click OK to add the gadget to the plot.
- Click the triangle button
 to the right of the ROI box and select New Output to generate the report worksheet.
- Bring up the context menu again to select Go to Report Worksheet to open the result worksheet.
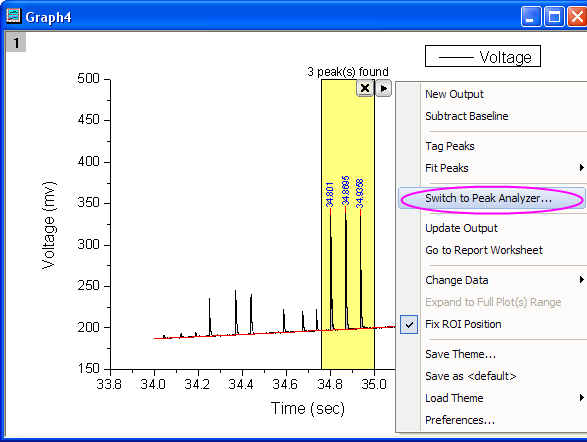
- Now we are going to open the Peak Analyzer to carry out peak fitting. Bring up the context menu and choose Switch to Peak Analyzer.
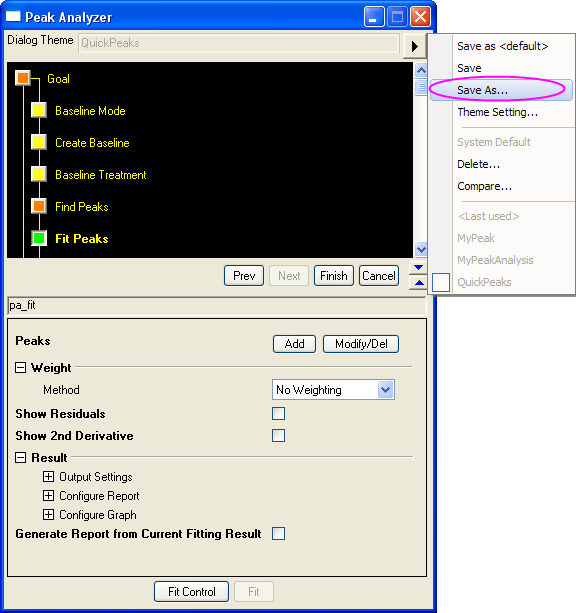
- The Peak Analyzer is opened, the Fit Peaks goal is already selected, the baseline mode and peak finding method follow the settings in the Quick Peaks gadget.
- Go to the Fit Peaks page directly and click the Fit button to fit the three found peaks with default Gaussian function.
- Click the
 button and select Save As in the context menu to save this analysis as a theme with the name MyQuickPeaks.
- In the Peak Analyzer, click the Finish button to generate the peak fitting results.
| Notes: The theme can be used in the batch peak analysis. Select Analysis:Peaks and Baseline:Batch Peak Analysis using Theme to open the paMultiY dialog. The batch peak analysis is very useful when you have multiple data files that are similar. You can refer to this example for more details.
|