6.12.15 Convert Data from Spherical Coordinate to XYZ and Make a 3D Plot
Contents

|

|
Summary
In this tutorial, we will look at what is involved in creating the 3D graph with spherical coordinate data, as well as using X-Function sph2cart to convert data in a workbook or matrix from spherical coordinate to Cartesian coordinates.
It is important to go over the Converting Algorithm for sph2cart, and notice that Origin use  as the elevation and
  as the azimuth in the transform formula.
 \ast cos \left ( \theta \right );")
 \ast sin \left ( \theta \right );")
;")
What will you learn
- Convert data in a worksheet (virtual matrix) from spherical coordinate to Cartesian coordinates and make a 3D surface plot.
- Convert data in a matrix object from spherical coordinate to Cartesian coordinates and make a 3D surface plot.
- Convert data in three matrix objects from spherical coordinate to Cartesian coordinate and make a discrete 3D surface plot.
- Convert data in a worksheet(XYZ) from spherical coordinate to Cartesian coordinate(XYZ) and make a 3D space curve.
Steps
3D Surface plot with colormap for data in virtual matrix
Origin can create surface plot with data in virtual matrix (spherical coordinate) and add colormap for it. The following steps introduce the plot of a ellipsoid with colormap surface.
This tutorial is associated with <Origin EXE Folder>\Samples\Tutorial Data.opj.
- Open the Tutorial Data.opj and browse to the folder: Spherical Coordinates.
- Open the virtual matrix data ellipsoid in tutorial data, the structure of the virtual matrix is shown in graph below:
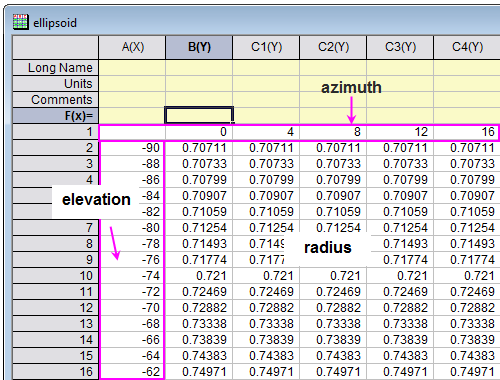
- In this example, the azimuth is from 0 to 360, and the elevation
 is from -90 to 90. The unit used for angle is degree.
- Open the Script Window, type in code below and run:
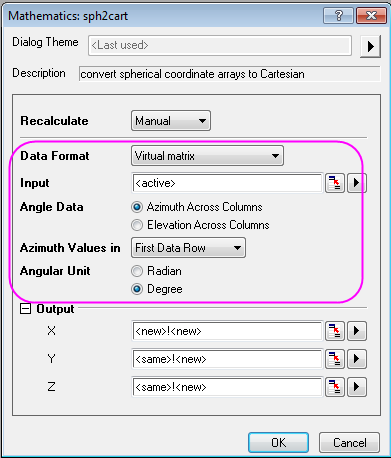
sph2cart -d;- Setting the sph2cart dialog follows graph below, then click OK. Three new matrix objects will be created which are corresponded to XYZ.
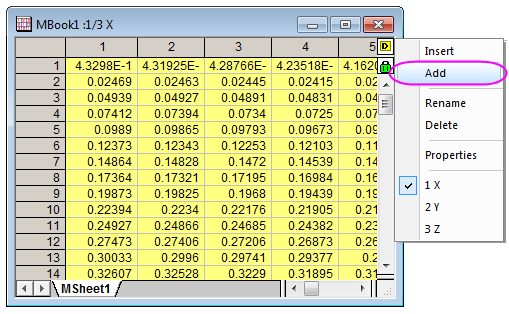
- Then add an extra matrix object "4" after the matrix Z in Matrix Layer to act as the colormap.
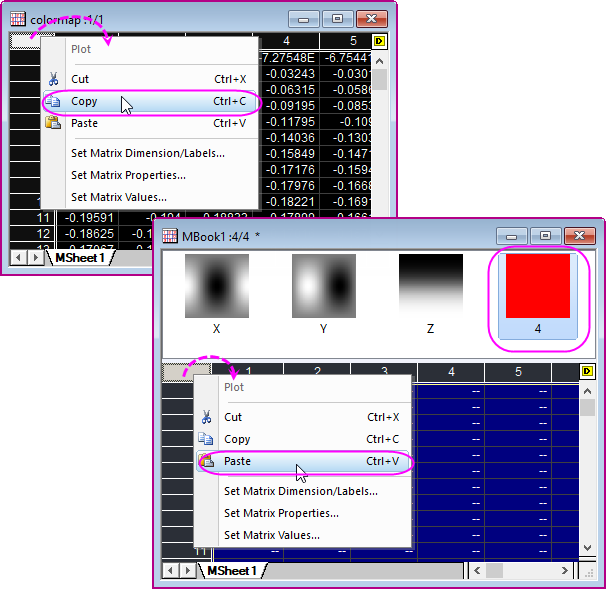
- Copy the data in colormap matrix in Spherical Coordinates folder, paste the data to the new added matrix object.
- Now, you will plot the Matrix into a 3D surface, click on the thumbnail of matrix object "Z" to activate it, click Plot > 3D : 3D Colormap Surface to plot a 3D surface.
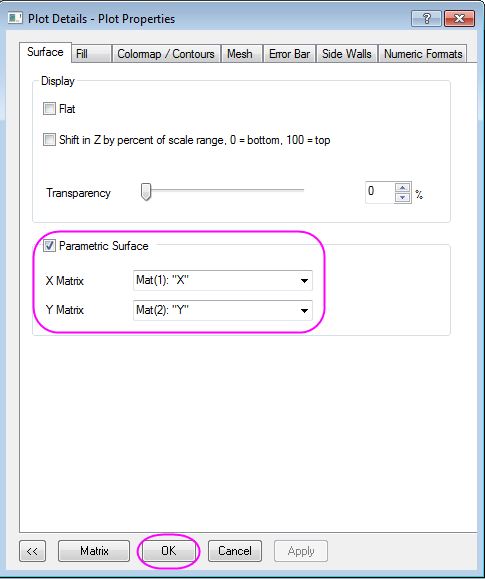
- Double click the surface to open the Plot Details dialog. Set the Parametric Surface in dialog follows graph below, and click OK to apply the settings.
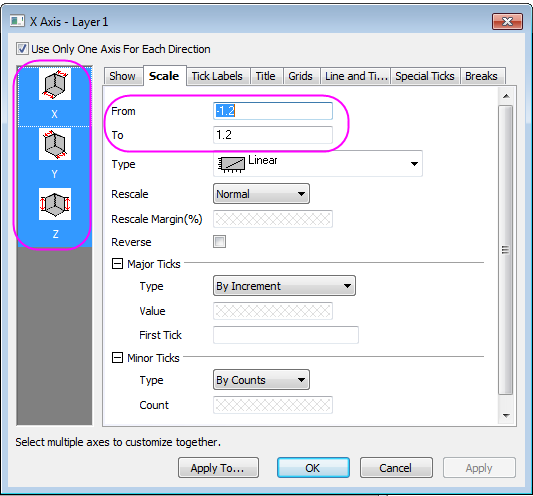
- Click CTRL+R to rescale the axis, double click the axis to open the Axis dialog, change to scale for XYZ axis from -1.2 to 1.2, click OK to close the dialog.
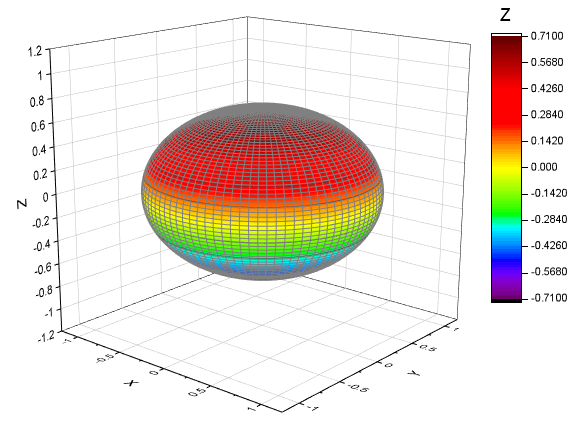
- You graph may looks like this:
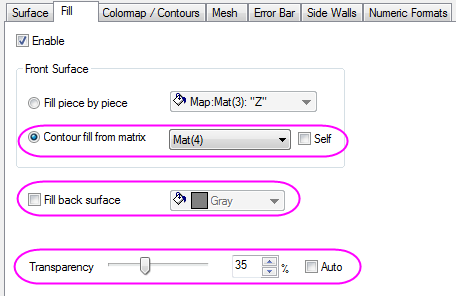
- Next we will apply the colormap to the ellipsoid, double click the surface to open the Plot Details dialog, go to the Fill tab, change the Contour fill from matrix into Mat(4).
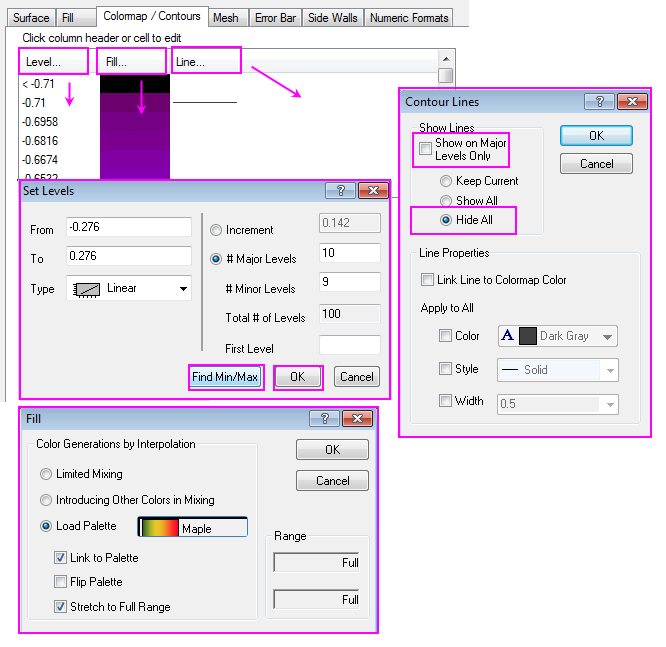
- Go to the Colormap/Contours tab, you can click the table head to open the Set Levels, Fill and Contour Lines dialog. Set the Level by Find Min/Max, click OK to apply, and set Fill by load palette "Maple", click OK, then select "Hide All" to hide all lines, click Apply to apply the settings.
- Go to the Mesh tab, deselect the Enable checkbox to close the mesh line, click OK to close the dialog.
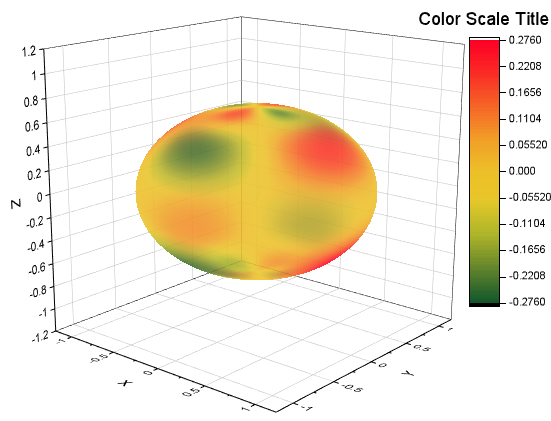
- the finished graph is similar to this:
The azimuth and elevation can be unevenly spaced in |
") space.
space.
Convert data in a matrix object and make a 3D surface plot
- Origin can construct a
") surface function under spherical coordinates. The azimuth, elevation and radius are placed in the same matrix. Before set matrix values form a spherical coordinates equation, you can refer to sph2cart for the transforming relations and definition of azimuth and elevation in our system.
surface function under spherical coordinates. The azimuth, elevation and radius are placed in the same matrix. Before set matrix values form a spherical coordinates equation, you can refer to sph2cart for the transforming relations and definition of azimuth and elevation in our system. - Create a new a matrix, and select Matrix: Set Dimension and Labels in main menu. Set the Dimension
 , and map Column to X by
 ") , map Column to Y by
, map Column to Y by ") . X and Y are the Angle Data, where X is the azimuth which is across columns and Y is the elevation.
. X and Y are the Angle Data, where X is the azimuth which is across columns and Y is the elevation.
- In this example, the azimuth is from 0 to
 , and the elevation is from
  to
to  . The unit used for angle is radian.
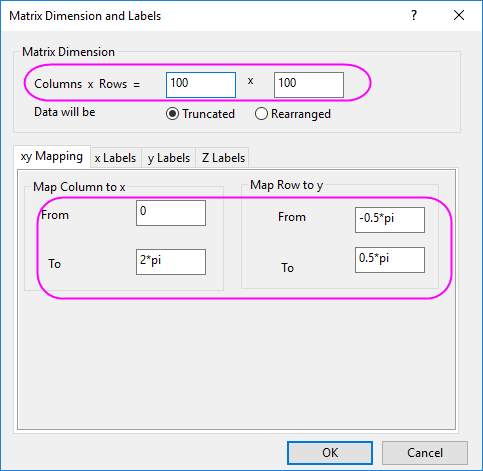
- In this example, the azimuth
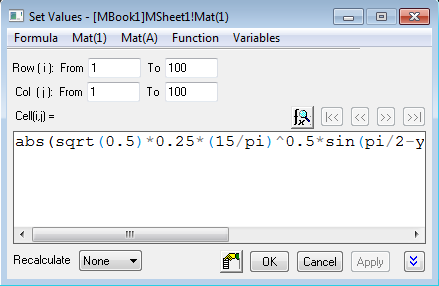
- Select Matrix: Set Values in main menu. The formula entered in the Set Values dialog should be
abs(sqrt(0.5)*0.25*(15/pi)^0.5*sin(pi/2-y)*sin(pi/2-y)*(sin(2*x)-cos(2*x)))- We set the matrix values by using spherical harmonics,
 is specific set of spherical harmonics, and the linear combinations of is corresponded to the d-orbitals of the hydrogen atom (i.e.
  ).
).  \right |\; \; (1)")
 and
and  in function (1) are:
cos(2\theta )")
sin(2\theta )")
-
- Next you can convert the matrix from spherical coordinates to Cartesian by using X-Function sph2cart. Select Window: Script Window in main menu, then enter the script below and click Enter to execute:
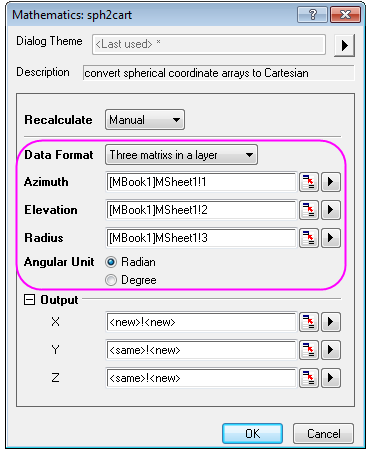
sph2cart -d- Set the sp2cart dialog follows graph below, the single matrix object is used as input data:
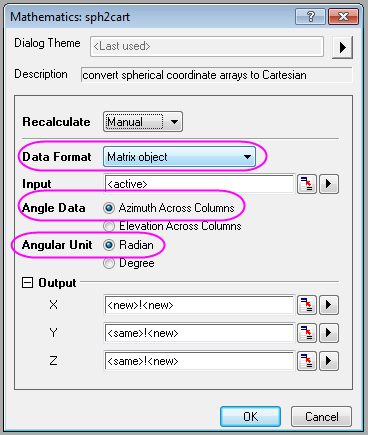
- After clicking OK, the results well be created in a new Matrix Sheet (MSheet2).
- Now, you will plot the Matrix into a 3D surface. With Matrix object Z in MSheet2 active,
- select Plot > 3D : 3D Colormap Surface in main menu.
- Double click the surface to open the Plot Details dialog, set the parametric surface follows graph below, and click OK.
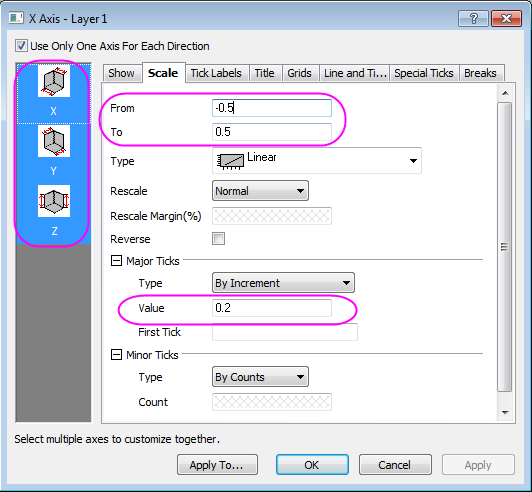
- Click CTRL+R to rescale the axis, double click the axis to open the Axis dialog, change to scale for XYZ axis from -0.5 to 0.5, set the vvalue for Major Ticks to 0.2, click OK to close the dialog.
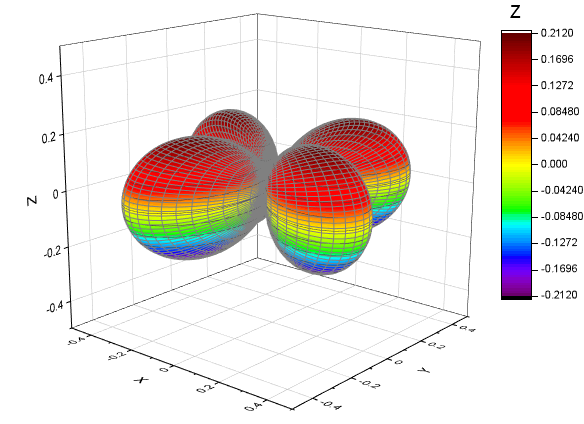
- The graph created is similar to this:
- Double click the surface to open the Plot Properties. Go to the Colormap/Contours tab, click the Level/Fill/Line button and set the dialogs separately.
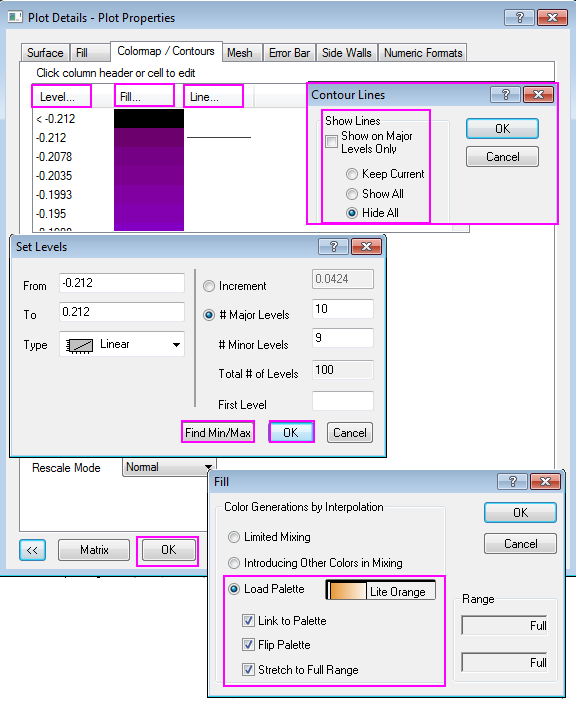
- Then go to the Mesh tab, deselect the Auto checkbox for Transparency and change the value to about 70%.

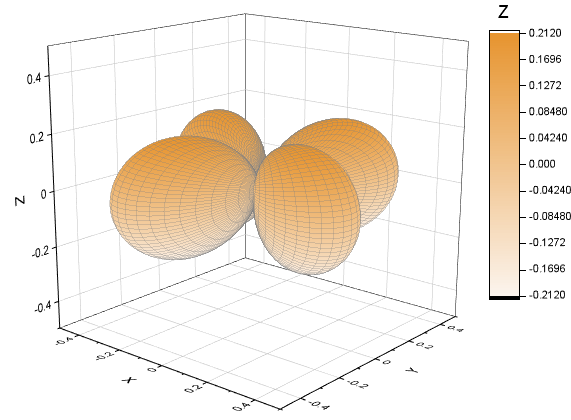
- You can refer to Parametric Surface tutorial for details about colormap setting. The finished Graph are shown below:
Convert data in three matrix objects and make a 3D surface plot
Origin can construct a surface function under spherical coordinates. The azimuth, elevation and radius are placed in the different matrix. The following steps shows how to construct multiple surfaces by using three matrix and use sph2cart to convert them into XYZ space.
- Create a new matrix. Set the Matrix Dimension
 in Matrix Dimension and Labels dialog, then click OK.
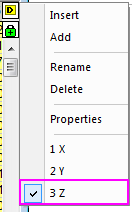
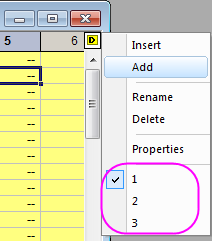
 - Click the D button on the right corner of the matrix and click Add to add another two matrix objects in MatrixBook.
- The azimuth will be put into the first matrix object. With the first matrix object active (Click the D button and switch between 1/2/3), click Matrix: Set Values in main menu. The matrix values for azimuth will be set in this way:
- Set the Matrix value use the expression below:
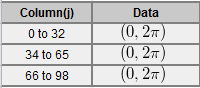
(j==33||j==66)?1/0:(pi/32*j*(j<33)+pi/32*(j-33)*(j>33&&j<66)+pi/32*(j-66)*(j>66))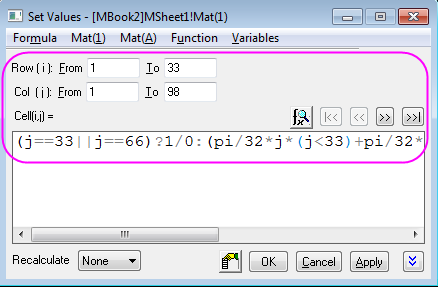
- The value from 0 to loop 3 times, and the Column (33),Column (66) should be missing values.
- The elevation will be put into the second matrix object (select matrix 2 in graph in step 2). Set the values for elevation by using expression:
pi/32*(i-17)
- The radius (expression below) will be put into the third matrix object.
![Col(i,j)=\begin{cases}
1 & \text{ if } i\in [1,32] \\
0.7 & \text{ if } i\in [33,65] \\
0.4& \text{ if } i\in [66,98] \\
\end{cases}](/tutorials/zh/images/Convert_Data_from_Spherical_Coordinate_to_XYZ_and_Make_a_3D_Plot/math-7abab8c0325b08ec55387a3771b2aee6.png?v=0 "Col(i,j)=\begin{cases}
1 & \text{ if } i\in [1,32] \\
0.7 & \text{ if } i\in [33,65] \\
0.4& \text{ if } i\in [66,98] \\
\end{cases}")
- The way for setting the values for radius is also piecewise, you can refer to the step 3, 4, 5 and use the set value code below:
1*(j<33)+0.7*(j>33&&j<66)+0.4*(j>66)
- After setting values for three matrix, you can convert the data to XYZ space by using sph2cart. Open the Script Window,type in code below and run:
sph2cart -d;- Setting the sph2cart dialog follows graph below, then click OK. Three new matrix for XYZ will be created.
- Create 3D surface graph by using XYZ matrix object created in new matrix layer. The steps are very similar to steps 5,6,7,8 in above section Convert data in a matrix object and make a 3D surface plot.
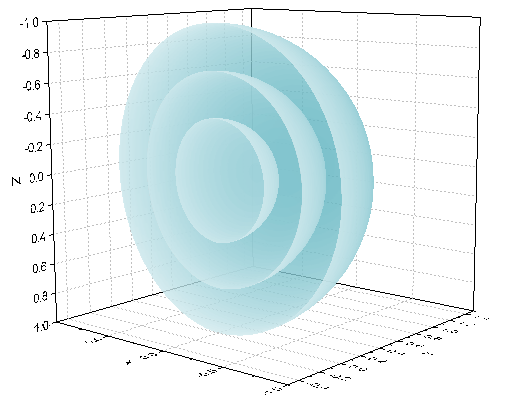
- The finished Graph is showed below:
Convert data in three columns and make a 3D space curve
Origin can create 3D space curve with unevenly spaced data in XYZ column (spherical coordinates). The following steps introduce the plot of a non-isometric spiral with a sphere shape.
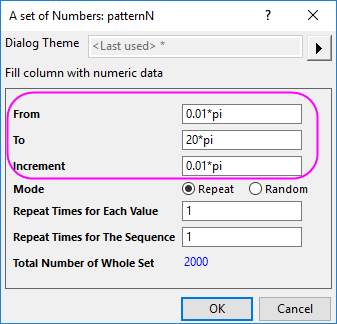
- Create a new workbook with three columns X, Y and Z. Set values from
 to
to  for X column by Fill Column With: A set of Numbers
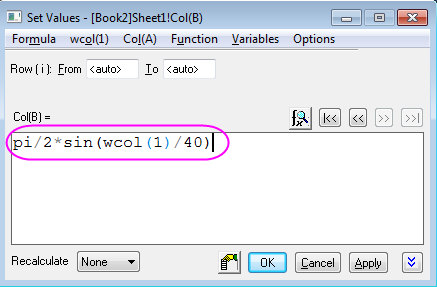
- Set value for Y column by Set Column Values
- Set value for Z column by Set Column Values and set as constant value "4"
- In this example, the X, Y, Z are corresponded to Azimuth, Elevation, Radius, respectively.
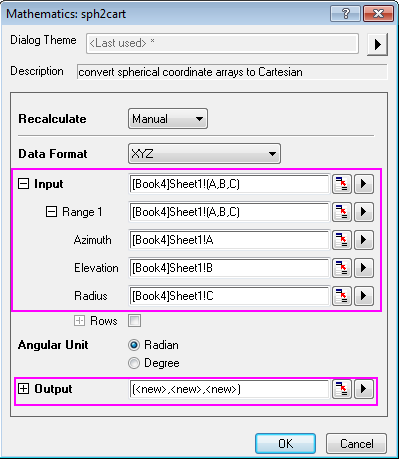
- Open the Script Window, type in code below and run:
sph2cart -d;- Setting the sph2cart dialog follows graph below, then click OK. Three new columns for XYZ will be created.
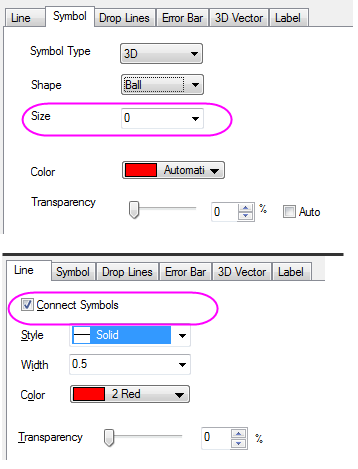
- Plot the new XYZ with Plot > 3D : 3D Scatter. Set Symbol size to 0 and connect Symbols with line,click OK.
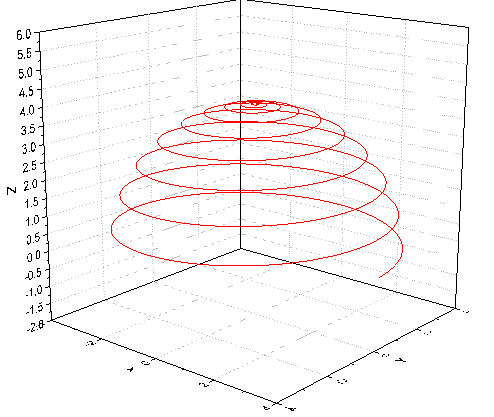
- Further adjust the scales and the perspective view, the finished graph is similar to graph below:
With new created XYZ data, you can plot a 3D surface plot as well by selecting Plot > 3D : 3D Colormap Surface with XYZ columns highlighted.
The azimuth and elevation in X and Y can be evenly or unevenly spaced in |