6.8.5 Contour Plot with Vector Overlay
Contour-Overlay-Vector
Summary
This tutorial will demonstrate how to create a contour plot with vectors overlay.
What you will learn
This tutorial will show you how to:
- Create and customize a contour graph and its color scale
- Create the XYAM vector graph
- Merge the two graphs
Steps
This tutorial is associated with <Origin EXE Folder>\Samples\Tutorial Data.opj.
Also, you can refer to this graph in Learning Center. (Select Help: Learning Center menu or press F11 key , and then open Graph Sample: Contour)
Create the Contour Graph
- Open Tutorial Data.opj and browse to the Contour Plot with Vector Overlay folder in Project Explorer (PE).
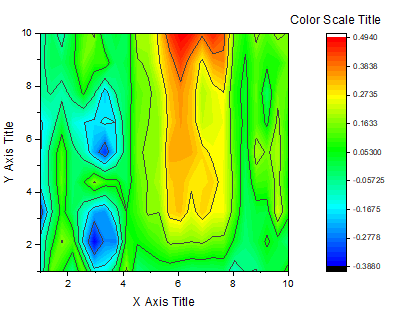
- Activate the W147 matrix and select Plot> Contour: Contour - Color Fill in the menu. The graph below will be created:
- Click on the plot, and in the pop-up mini toolbar, click the Set Levels button to open the Set Levels dialog, and then set the following levels:
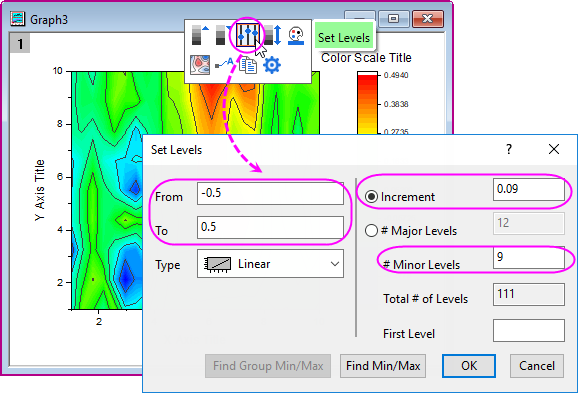
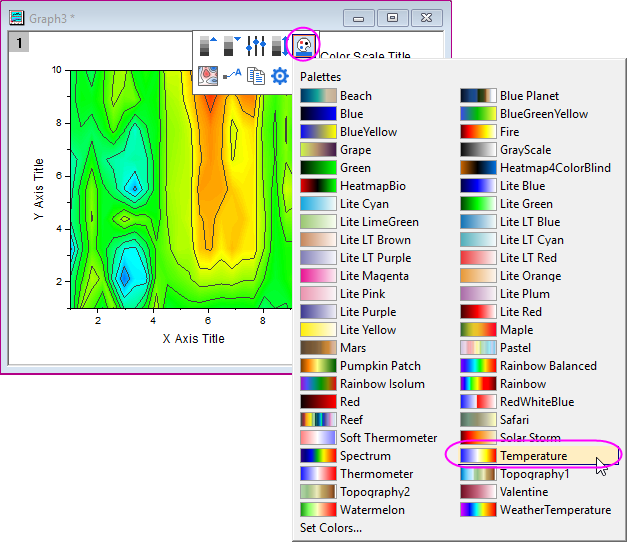
- Click OK button. Click on the plot again, in the pop-up mini toolbar, click the Palette button to choose Temperature from the list.
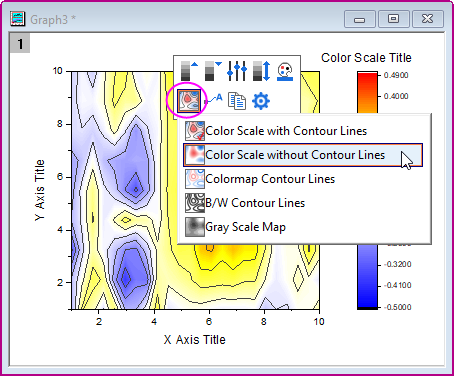
- Click on the plot again, in the pop-up mini toolbar, click the Contour Style button to select Color Scale without Contour Lines from the list.
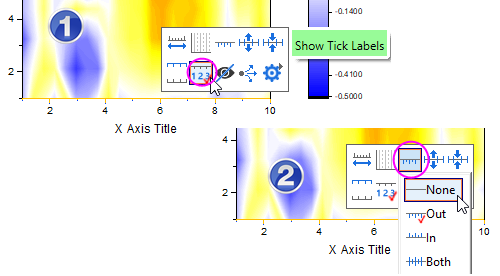
- Let's make preparations for the third section Merge the Two Graphs. First, click on X axis, in the pop-up mini toolbar, click Show Tick Labels button to hide the labels. Second, with the pop-up mini toolbar expanded, click Tick Style button to select None from the list.
Delete X and Y Axis title.
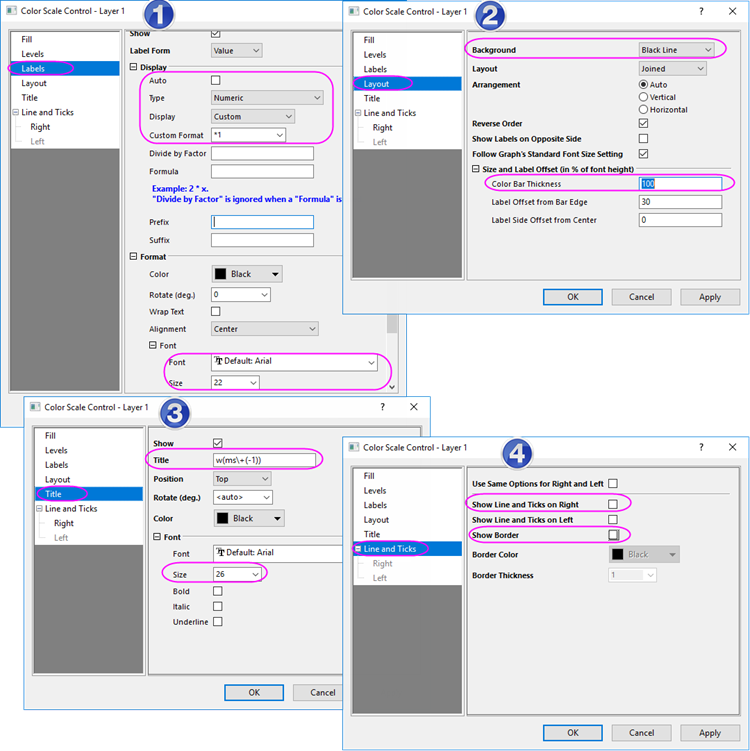
- To change the color scale, double-click on the scale object to open the Color Scale Control dialog. Do the settings below:
- In the Labels node,
- Clear the Auto check box under Display branch, set Custom Format to *1.
- Set the Font Size to 22.
- In the Layout page,
- Select Black Line from the Background drop-down list,
- Set Color bar thickness to 100.
- In the Title page, enter w(ms\+(-1)) in the Title box and set Font Size to 26.
- In the Line and Ticks page, uncheck Show Line and Ticks on Right and Show Border check box
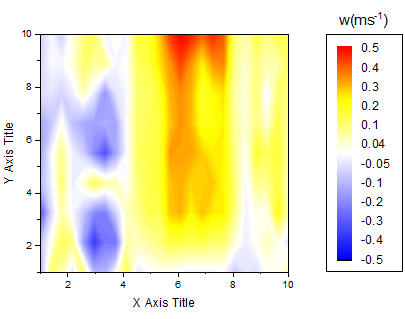
- Click OK and position the color scale in the desired location on the right side of the graph by selecting and dragging it.
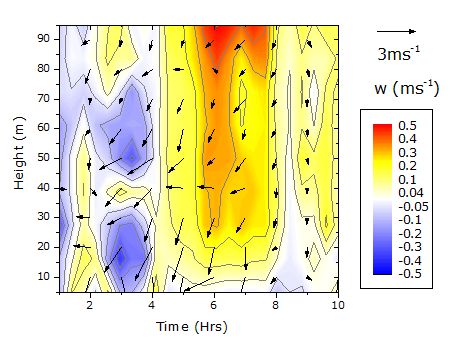
- Finally, the contour plot should now appear as shown below:
Create the XYAM Vector Graph
-
Activate the WOR81147 worksheet, highlight the last three columns and select Plot > Specialized : Vector XYAM in the menu.
- Double-click on any vector to bring up the Plot Details dialog on the Vector tab. Use the settings shown below:
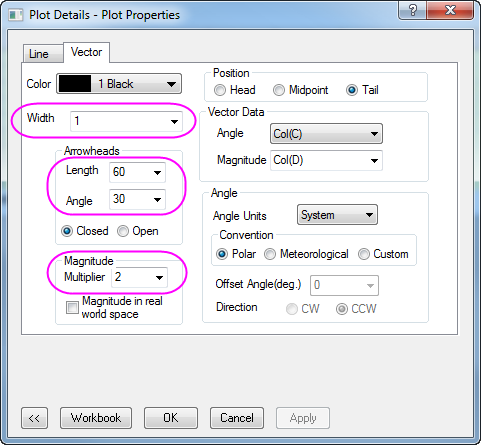
Then click OK.
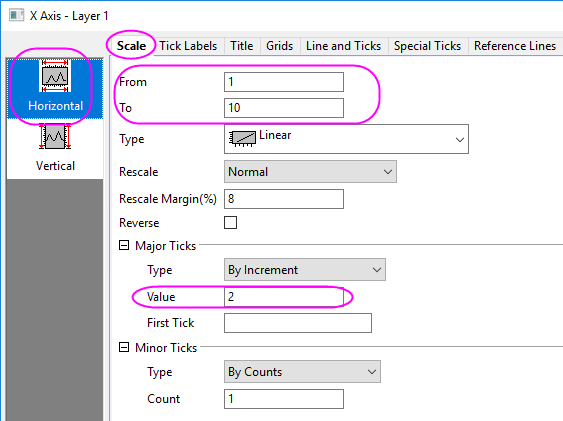
- To update the axis scales, select Format: Axes: X Axis... to open the dialog and complete the following:
- On the Scale tab, set X From = 1, To = 10 and Value of Increment = 2.
- On the Scale tab, choose Vertical icon in the left panel of Axis dialog. Set the scale of Y as From = 5, To = 95, and Value of Increment = 10.
- Go to the Line and Ticks tab in the Axis dialog. Press Ctrl key to select the Top and Right icon in the left panel. Then check Show Line and Ticks check box, and set the Style of Major Ticks and Minor Ticks to In. The top X and right Y axis will be shown with line and ticks.
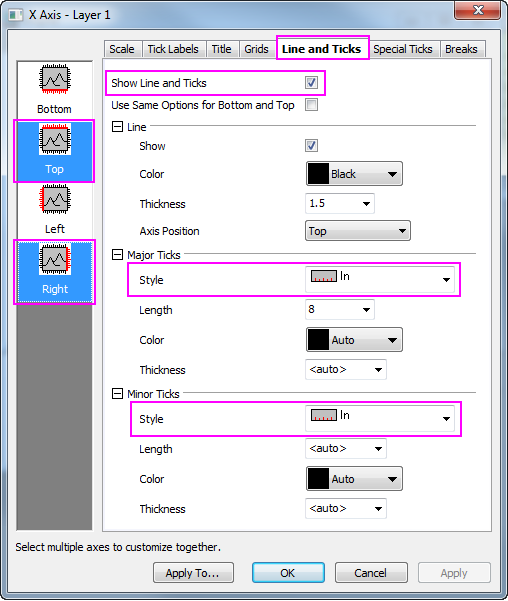
- Click OK.
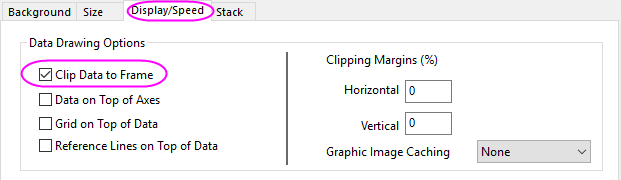
- At this stage, you may notice that the vectors extend outside the axes (layer frame). To make sure they display within the layer frame,
select Format: Layer and in the Display/Speed tab check the Clip Data to Frame box. Click OK.
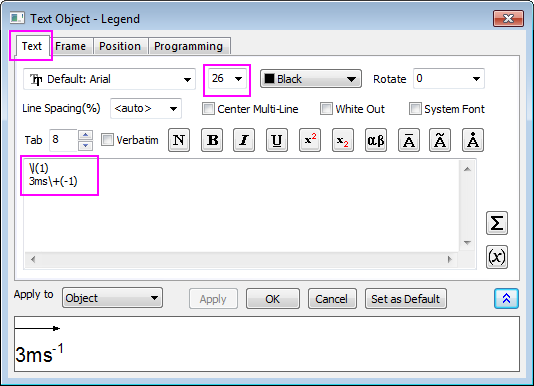
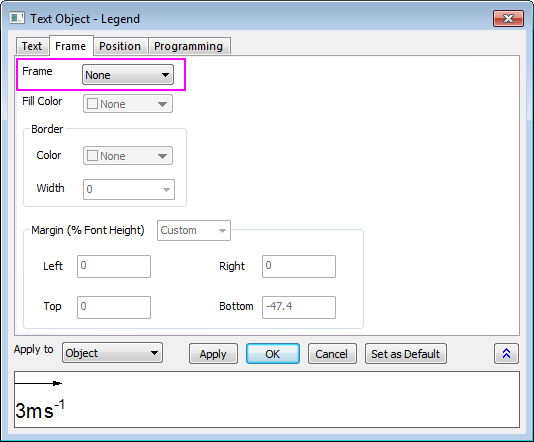
- Right-click on the legend of the vectors graph, and select Properties... in the context menu to open the Object Properties. Set the dialog as shown below:
Merge the Two Graphs
The contour and vector graphs are generated by the steps above, and are ready to be merged into one.
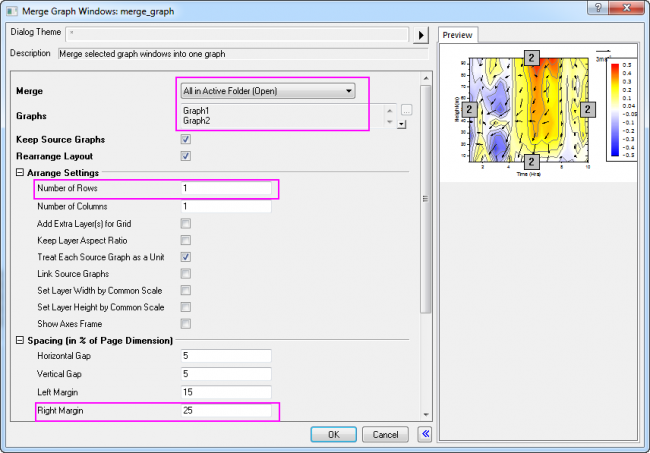
- Minimize or Hide all other graphs except for the contour and vector graphs created using the instructions above. With one of the two graphs active, select Graph: Merge Graph Window... from the main menu.
- In the Merge Graph dialog, specify the settings as the following:
- Expand the Arrange Settings node, and set the Number of Rows as 1.
- Expand the Spacing (in % of Page Dimension) node, and enter a value of approximately "25" in the Right Margin text box to show the color scale legend from the contour plot. Click OK.
- To set font type as Verdana for all the objects:
- Set the objects individually, by clicking on the object and selecting Verdana in the Font button
 in the Format toolbar.
Or
- The final graph should look something like this: