提示:此部分只提供英文原文,敬请谅解!
1.312 FAQ-1236 How can I generate separate graph pages for statistics graph tools?
Last Update: 1/5/2026
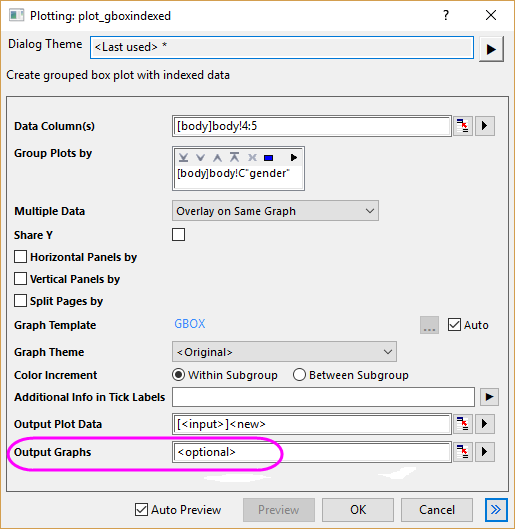
From Origin 2025b, statistics graphs such as Grouped Column Plot, Grouped Box Chart and P-P Plot etc. are embedded in the report sheet for better support of batch plotting.
If you want the charts to be plotted into separate graph windows, as in the earlier versions,
Enter
<optional>
in Output Graphs edit box of the dialog.
Keywords:grouped box plot, PP plot, Q-Q plot, stats graph, individual page