|
OriginPro
|

|
|
OriginPro
|
|
Public Member Functions | |
| __repr__ (self) | |
| lt_range (self) | |
| rescale (self, skip='') | |
| group (self, group=True, begin=-1, end=-1) | |
| axis (self, ax) | |
| xlim (self) | |
| xlim (self, limits) | |
| ylim (self) | |
| ylim (self, limits) | |
| zlim (self) | |
| zlim (self, limits) | |
| set_xlim (self, begin=None, end=None, step=None) | |
| set_ylim (self, begin=None, end=None, step=None) | |
| set_zlim (self, begin=None, end=None, step=None) | |
| xscale (self) | |
| xscale (self, scaletype) | |
| yscale (self) | |
| yscale (self, scaletype) | |
| zscale (self) | |
| zscale (self, scaletype) | |
| remove (self, any obj) | |
| plot_list (self) | |
| remove_plot (self, plot) | |
| add_plot (self, obj, coly=-1, colx=-1, colz=-1, type='?', colyerr=-1, colxerr=-1) | |
| add_mplot (self, ms, z, x=-1, y=-1, cm=-1, type=103) | |
 Public Member Functions inherited from originpro.base.BaseLayer Public Member Functions inherited from originpro.base.BaseLayer | |
| __str__ (self) | |
| activate (self) | |
| destroy (self) | |
| label (self, name) | |
| remove_label (self, label) | |
| add_label (self, text, x=None, y=None) | |
| add_line (self, x1, y1, x2, y2) | |
| Public Member Functions inherited from originpro.base.BaseObject | |
| __init__ (self, obj) | |
| __del__ (self) | |
| __bool__ (self) | |
| index (self) | |
| get_str (self, prop) | |
| get_int (self, prop) | |
| get_float (self, prop) | |
| set_str (self, prop, value) | |
| set_int (self, prop, value) | |
| set_float (self, prop, value) | |
| method_int (self, name, arg='') | |
| method_float (self, name, arg='') | |
| method_str (self, name, arg='') | |
| lt_exec (self, labtalk) | |
| name (self) | |
| name (self, value) | |
| lname (self) | |
| lname (self, value) | |
| comments (self) | |
| comments (self, value) | |
| show (self) | |
| show (self, value) | |
| usertree (self) | |
| usertree (self, tr) | |
| userprops (self) | |
Public Attributes | |
| obj | |
| Public Attributes inherited from originpro.base.BaseLayer | |
| obj | |
| Public Attributes inherited from originpro.base.BaseObject | |
| obj = obj | |
Protected Member Functions | |
| _add_plot (self, ranges, type) | |
Static Protected Member Functions | |
| _plot_type (type) | |
| _to_lt_str (col, wks) | |
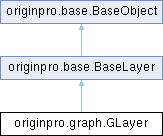
This class represents an Origin Graph Layer, it holds an instance of a PyOrigin GraphLAyer
|
staticprotected |
return empty str if not valid, otherwise return LabTalk column index as str
| originpro.graph.GLayer.add_mplot | ( | self, | |
| ms, | |||
| z, | |||
| x = -1, | |||
| y = -1, | |||
| cm = -1, | |||
| type = 103 ) |
plot a 3D parametric surface

Parameters:
    ms (MSheet): matrix sheet with the data to plot
    z (int): matrix object index for Z
    x (int): matrix object index for X, must be > z
    y (int): matrix object index for Y, must be > z

Examples:
    #assmues X,Y,Z contains the mesh grid data
    data=[]
    data.append(Z)
    data.append(X)
    data.append(Y)
    ms = op.new_sheet('m')
    ms.from_np(np.array(data))
    gl = op.new_graph(template='GLparafunc')[0]
    gl.add_mplot(ms, 0, 1, 2)
| originpro.graph.GLayer.add_plot | ( | self, | |
| obj, | |||
| coly = -1, | |||
| colx = -1, | |||
| colz = -1, | |||
| type = '?', | |||
| colyerr = -1, | |||
| colxerr = -1 ) |
Add plot to graph layer
Parameters:
    obj(WSheet): worksheet to plot from, or a DataRange
    coly(int or str): Y column to plot
    colx(int or str): X column, it not specified, X column on the left, can use '#' to indicate use row number as X
    colz(int or str): Z column to plot
    type(str): 'l'(Line Plot) 's'(Scatter Plot) 'y' (Line Symbols) 'c' (Column) '?' auto(template)
    colyerr(int or str): Y Error column to plot
    colxerr(int or str): X Error column to plot
Returns:
    (Plot): the newly added Plot object

Examples:
    gl = op.find_graph()[0]
    wks = op.find_sheet('w','Book1')
    p = gl.add_plot(wks,'C')
    p.color = '#5f0'
    gl.rescale()
    gl.add_plot(wks,1,3)#C(x), B(y)
    gl.add_plot(wks,1,'#')#B(y) vs Row Numbers
| originpro.graph.GLayer.axis | ( | self, | |
| ax ) |
Creates a new Axis object

Parameters:
    ax (str): One of 'x', 'y', or 'z'

Returns:
    (Axis)

Examples:
    graph = op.new_graph()
    layer2 = graph.add_layer(2)
    ay=layer2.axis('y2')
    ay.title = 'Right value'
| originpro.graph.GLayer.group | ( | self, | |
| group = True, | |||
| begin = -1, | |||
| end = -1 ) |
Group/Ungroup data plots

Parameters:
    begin(int): plot index, -1 is the same as 0
    end(int): -1 to the last, otherwise ending plot index (0-offset)
Returns:
    None
Examples:
    graph = op.new_graph(template='scatter')
    gl=graph[0]
    plot = gl.add_plot('[Book1]1!(A,B:C)', type='s')
    gl.group(True,0,1)
    plot = gl.add_plot('[Book1]1!(A,D:0)', type='l')
    gl.group(True,2,3)
| originpro.graph.GLayer.lt_range | ( | self | ) |
Return the Origin Range String that identify Graph Layer object
Parameters:
    none
Returns:
    Origin Range String
Examples:
    gl=op.find_graph()[0]
    print(gl.lt_range())
| originpro.graph.GLayer.plot_list | ( | self | ) |
Returns list of Plot objects in the layer.

Parameters:

Returns:
    (list)

Examples:
    items = lay.plot_list()
    item = lay.plot_list()[0]
| originpro.graph.GLayer.remove | ( | self, | |
| any | obj ) |
remove object in the layer.

Parameters:
    obj: Can be graph object or plot object

Returns:
    None

Examples:
    gl=op.find_graph()[0]
    label = gl.label('xb')
    label.remove()
| originpro.graph.GLayer.remove_plot | ( | self, | |
| plot ) |
Removes plot from layer.

Parameters:
    plot (Plot or int) Instance of Plot or index of plot to remove

Returns:
    None

Examples:
    lay.remove_plot(3)
| originpro.graph.GLayer.rescale | ( | self, | |
| skip = '' ) |
update limits to show all the data, including color scale range is colormap is used

Parameters:
    skip(str): axis to skip(keep limits). Can be a combination of x,y,z,m where m is for colormap

Returns:
    None

Examples:
    gl=op.find_graph()[0]
    gl.rescale('x')#rescale Y only
    gl.rescale('m')#do not change colormap scale range
| originpro.graph.GLayer.set_xlim | ( | self, | |
| begin = None, | |||
| end = None, | |||
| step = None ) |
Sets X axis scale begin(From), end(To) and step(Increment)

Parameters:
    begin (float or None): axis new From or Begin value.
    end (float or None): axis new To or End value.
    step (float or None): axis new Step or Increment value.

Returns:
    New axis limits

Examples:
    g = op.new_graph()
    g[0].set_xlim(0, 1)
    g[0].set_xlim(step=0.2)
| originpro.graph.GLayer.set_ylim | ( | self, | |
| begin = None, | |||
| end = None, | |||
| step = None ) |
Sets Y axis scale begin(From), end(To) and step(Increment)

Parameters:
    begin (float or None): axis new From or Begin value.
    end (float or None): axis new To or End value.
    step (float or None): axis new Step or Increment value.

Returns:
    New axis limits

Examples:
    g = op.new_graph()
    g[0].set_ylim(1, 100, 20)
    g[0].set_ylim(begin=0)
| originpro.graph.GLayer.set_zlim | ( | self, | |
| begin = None, | |||
| end = None, | |||
| step = None ) |
Sets Z axis scale begin(From), end(To) and step(Increment)

Parameters:
    begin (float or None): axis new From or Begin value.
    end (float or None): axis new To or End value.
    step (float or None): axis new Step or Increment value.

Returns:
    New axis limits

Examples:
    g = op.new_graph()
    g[0].set_zlim(0, 5)
    g[0].set_zlim(step=1)
| originpro.graph.GLayer.xlim | ( | self | ) |
Property getter for X axis limits.
Parameters:
    none
Returns:
    New X axis limits
Examples:
    gl=op.find_graph()[0]
    print(gl.xlim)
| originpro.graph.GLayer.xlim | ( | self, | |
| limits ) |
Sets X axis scale begin(From), end(To) and step(Increment)
Parameters:
    limit(axis scale):(begin,end, step)
Returns:
    New axis limits
Examples:
    gl=op.find_graph()[0]
    gl.xlim=(2,9,3)
| originpro.graph.GLayer.xscale | ( | self | ) |
Property getter for X axis scale type.

Parameters:

Returns:
    Scale type of axis

Examples:
    st = lay.xscale
| originpro.graph.GLayer.xscale | ( | self, | |
| scaletype ) |
Property setter for X axis scale type.

Parameters:
    scaletype (int or str): Supported string value of scaltype:
        ['linear', 'log10', 'probability', 'probit', 'reciprocal', 'offset_reciprocal', 'logit', 'ln', 'log2']

Returns:
    New scale type of x axis

Examples:
    lay.xscale = 'log10'
| originpro.graph.GLayer.ylim | ( | self | ) |
Property getter for Y axis limits.
Parameters:
    none
Returns:
    Y axis limits
Examples:
    gl=op.find_graph()[0]
    print(gl.ylim)
| originpro.graph.GLayer.ylim | ( | self, | |
| limits ) |
Sets Y axis scale begin(From), end(To) and step(Increment)
Parameters:
    limit(axis scale):(begin,end, step)
Returns:
    New axis limits
Examples:
    gl=op.find_graph()[0]
    gl.ylim=(2,9,3)
| originpro.graph.GLayer.yscale | ( | self | ) |
Property getter for Y axis scale type.
Parameters:
    none
Returns:
    Scale type of axis
Examples:
    st = lay.yscale
| originpro.graph.GLayer.yscale | ( | self, | |
| scaletype ) |
Property setter for Y axis scale type.
Parameters:
    scaletype (int or str): Supported string value of scaltype:
        ['linear', 'log10', 'probability', 'probit', 'reciprocal', 'offset_reciprocal', 'logit', 'ln', 'log2']
Returns:
    New scale type of y axis
Examples:
    lay.yscale = 'log10'
| originpro.graph.GLayer.zlim | ( | self | ) |
Property getter for Z axis limits.
Parameters:
    none
Returns:
    Z axis limits
Examples:
    gl=op.find_graph()[0]
    print(gl.zlim)
| originpro.graph.GLayer.zlim | ( | self, | |
| limits ) |
Sets Z axis scale begin(From), end(To) and step(Increment)
Parameters:
    limit(axis scale):(begin,end, step)
Returns:
    New axis limits
Examples:
    gl=op.find_graph()[0]
    gl.zlim=(2,9,3)
| originpro.graph.GLayer.zscale | ( | self | ) |
Property getter for Z axis scale type.
Parameters:
    none
Returns:
    Scale type of axis
Examples:
    st = lay.yscale
| originpro.graph.GLayer.zscale | ( | self, | |
| scaletype ) |
Property setter for Z axis scale type.
Parameters:
    scaletype (int or str): Supported string value of scaltype:
        ['linear', 'log10', 'probability', 'probit', 'reciprocal', 'offset_reciprocal', 'logit', 'ln', 'log2']
Returns:
    New scale type of z axis
Examples:
    lay.zscale = 'log10'