29.7.8 Trellis
trellis

Data Requirements
You need to have at least one Y column as input data. Optionally, you can have an additional associated Y error column for each Y column. Other column(s) provides grouping information.
Creating the Graph
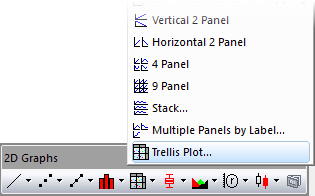
Open the plot_group dialog by one of three methods:
- Select Plot > Categorical: Trellis Plot menu items
- Click the
 button in the 2D Graphs toolbar
In the dialog that opens, select the input data range. Add at least one group column in either direction and determine where to color-map the data. You can then generate a trellis plot.
You can refer to the section below for the detailed dialog controls:
The plot_group Dialog Box
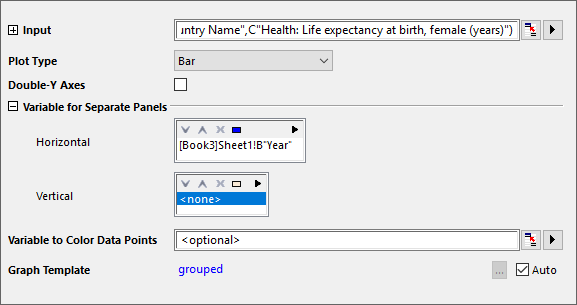
| Input
|
This branch is used to specify the input data.
|
| Plot Type
|
Specify the plot type of trellis.
|
| Double-Y Axes
|
This box is not used the standard trellis plot. See this page for information on the Double Y Trellis.
|
| Variable for Separate Panels
|
This branch is used to specify the grouping information. Each direction includes a display box and a toolbar with five buttons 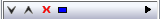 : :
- Display Box
- The group range(s) selected using Add button will display in this box. The first selected group ranges will be set set primary categorization and form the bottom line of the column plot's group table; the secondary groups selected would continue grouping based on the primary categorization and forming the second layer of the group table, and so forth.
- Add button

- Click this button then choose a column from menu; or click Select Columns to open the Column Browser and add column(s) to the Display Box as grouping range(s). You can add up to 5 grouping ranges.
- Remove button

- Remove the selected data range(s) from the Display Box. This button is available when you select one or more data ranges in the Group Column(s) box.
- Move Up button

- Move the selected data range(s) up in the Display Box. This changes the grouping sequence.
- Move Down button

- Move the selected data range(s) down in the Display Box. This changes the grouping sequence.
- Select All button

- Select all data range(s) down in the Group Column(s).
|
| Variable to Color Data Points
|
Specify the column used to color-map the plot.
|
| Graph Template
|
Specify the template used to create the group plot.
|
Template
grouped.otp (installed to the EXE folder of Origin)
Notes
- Refer to this page for more details of creating and customizing a trellis plot.
- To sort the grouping range (this would be the "Country Name" variable in the above example) by something other than the default alphabetical order, select the column, right-click and choose Set as Categorical and modify the list order in the Categories tab.