
This plot requires at least two Y columns as input data. Optionally, you can have an additional associated Y error column for each Y column. Other column(s) provides grouping information.
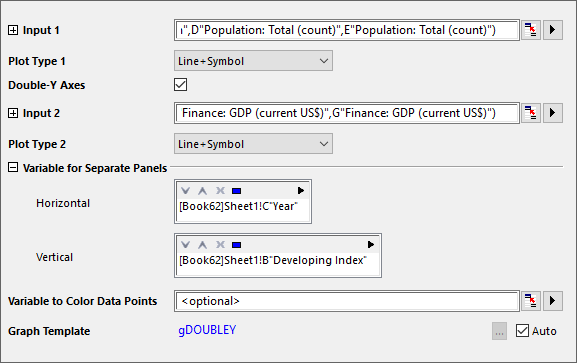
| Input 1 | This branch is used to specify the input data for the left-Y axis. |
|---|---|
| Plot Type 1 | Choose the plot type for Input 1. |
| Double-Y Axes | This box is checked, by default, for the Double Y trellis. |
| Input 2 | This branch is used to specify the input data for the right-Y axis. |
| Plot Type 2 | Choose the plot type for Input 2. |
| Variable for Separate Panels | This branch is used to specify the grouping information. Each direction includes a display box and a toolbar with five buttons  : :
|
| Variable to Color Data Points | Specify the column used to color-map the plot. |
| Graph Template | By default, Auto is selected and the default Double Y graph template is used. To specify a different graph template, clear the Auto box and browse to and select your template. |
gDOUBLEY.otpu (installed to the Origin program folder).