Axes Dialog for Smith Chart
This Axis Dialog is for customizing axes and ticks for Smith Chart.
Contents
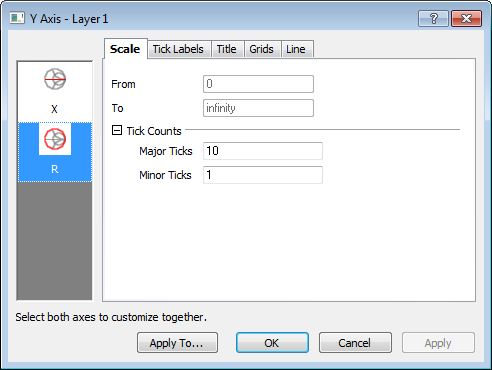
Scale
This tab is used to control the Major Ticks and Minor Ticks counts for the X and R axis.
Tick Label
The Show check box is used to specify whether to display labels for the specific axis.
| Display | This tab provides control of tick label display. It is identical to the tick label Display controls in the standard 2D Axis dialog except that it does not have Type and Formula option. |
|---|---|
| Format | This tab provides controls to customize the tick label format. It is generally the same as the tick label Format controls in the standard 2D Axis dialog except that it does not have Wrap Text and Alignment option. |
Title
This tab is used to control the axis title.
The Show check box is used to specify whether to display a title for the specific axis.
The other controls are generally the same as the Title tab controls of the general 2D Axis dialog.
Grid
This page provides options to customize the grid lines of X or R axes.
Major and minor grid lines can be customized separately in the Major Grid Lines or Minor Grid Lines tree node. The controls of these two tree nodes are shared with the corresponding tree nodes in the Grids tab of the general 2D Axis dialog.
Line
This tab is used to customize the line and tick styles of Radial axis.
| Show |
Specify whether to show the axes. |
|---|---|
| Color |
Select line color from the drop-down list. |
| Thickness |
Type or select the line width from this combination box. |