![]() See more related video:Using the Layer Contents Dialog
See more related video:Using the Layer Contents Dialog
![]() See more related video:Using the Layer Contents Dialog
See more related video:Using the Layer Contents Dialog
The Layer Contents dialog box is used to add or remove data plots from a graph layer, group and ungroup plots, and reorder (change the drawing order of) the data plots.
To open the Layer Contents dialog box:
|
Note: Prior to Origin 8.5, double-clicking on the graph layer icon would open the Plot Setup dialog box. You can restore this behavior in the current Origin session, by opening the Script window and typing @LID=1 <ENTER>. To make your change stick across Origin sessions, use the Set System Variables dialog box. |
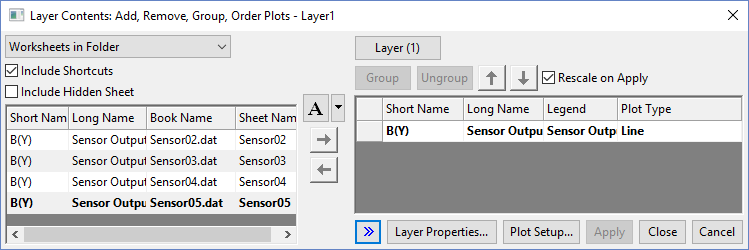
The left panel of the Layer Contents dialog box lists all available datasets. The right panel lists all datasets plotted in the layer.
To add a dataset to the current graph layer,
When you add a Y dataset to an existing graph via Layer Contents, you are also adding an associated X dataset. When adding a Z dataset to the graph, you are also adding the Z dataset's associated X and Y datasets. In any case, if no X column exists in the worksheet, Origin uses default X values. For more information, see Plot Designation.
Use the drop-down to filter the contents of the list box:
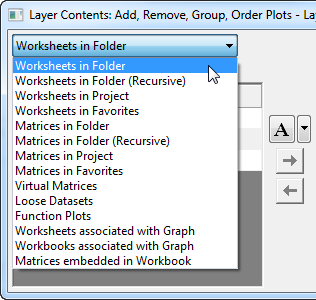
Multiple options are provided to easily select desired datasets, including options such as Worksheets associated with Graph which will only list datasets that belong to the same worksheet as the ones currently plotted in the graph and Virtual Matrices which will list all existing virtual matrices in the Virtual Matrix Manager.
Additionally, since Origin 2018b, Origin supports to add matrices as sheets. Base on this, Origin provides one more option Matrices embedded in Workbook to list all embedded matrices in current workbook.
For how to create a custom condition filter in the drop-down list please refer to this page.
| Note: Folder in Project has hierarchy, If you add graph in parent folder, then check the Layer Contents of the graph, you will find all the workbook both in parent folder and its sub folder in project listed when Worksheets in Folder(Recursive) is selected, in another case, you will find only workbook in parent folder listed when Worksheets in Folder is selected. |
Origin supports adding a shortcut to a window in another Project Explorer folder. When this check box is checked, shortcut windows in the current folder will be listed in the Available Datasets box.
For more details about shortcut windows, please refer to this page.
Check this check box to list the hidden sheet(s) (if any) in the Available Datasets box with gray color.
For more details about showing/hiding a worksheet, please refer to this document.
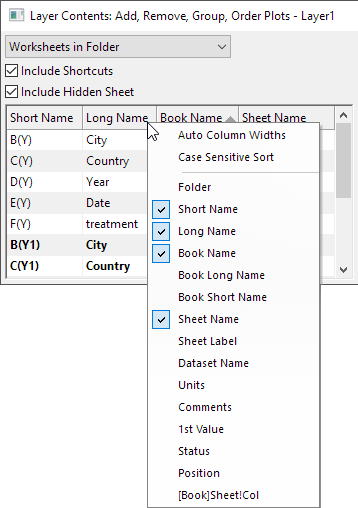
This list box display useful information of datasets in table form, such as workbook, worksheet, column labels, plot type, etc. You can:
The settings will be remembered when dialog is re-opened next time.
Notes:
|
For better viewing of your data, you can reorder dialog box column headings by dragging with your mouse. |
| Auto Column Widths | Auto-adjust the column widths |
| Case Sensitive Sort | When click column header to sort the list, case-sensitive is available. |
| Folder | Specify if show the folder which contains the datasets. |
| Book Name | Check it, if there is book long name, show long name of the book. If there is no book long name, show short name of the book. |
| Book Long Name | Specify if show the book long name in a column. |
| Book Short Name | Specify if show the book short name in a column |
| Sheet | Specify if show the sheet name. |
| Dataset Name | Specify if show the dataset name. |
| Long Name | Specify if show the dataset long name. |
| Short Name | Specify if show the dataset short name. |
| Units | Specify if show the units of datasets. |
| Comments | Specify if show the comments of datasets. |
| 1st Value | Specify if show the 1st Value of datasets. |
| Status | Specify if show the status of dataset, raw or locked. |
| Position | Specify if show the position of the dataset in sheet. |
| [Book]Sheet!col | Specify if show the range notation of the dataset. |
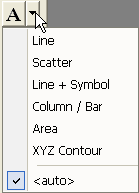
The Plot Type combo button located between the left and right panels allows the user to specify the plot type to use when adding dataset(s) to the layer. The drop-down list can be used to select the available plot types. The default setting of Auto ![]() will add the plot using applicable plot type, or using the plot type of the very first entry in the layer. E.g. When adding a Y dataset to layer with a line plot, the new plot will be added as a line plot. When a Z dataset is added to a 3D graph created from a matrix, the plot will be added as a 3D Line plot.
will add the plot using applicable plot type, or using the plot type of the very first entry in the layer. E.g. When adding a Y dataset to layer with a line plot, the new plot will be added as a line plot. When a Z dataset is added to a 3D graph created from a matrix, the plot will be added as a 3D Line plot.
The button ![]() is used to add selected dataset(s) to current graph layer. The button
is used to add selected dataset(s) to current graph layer. The button ![]() is used to removed the selected dataset(s) from current graph layer. Note that more than one dataset can be selected.
is used to removed the selected dataset(s) from current graph layer. Note that more than one dataset can be selected.
Select this box to automatically rescale the layer axes to show all the data after the Layer Contents dialog box is closed. Leave check box unchecked to maintain the current axes scales.
This list box includes all datasets currently plotted in the layer.
To remove a dataset from the layer, highlight the dataset(s) in the Layer Contents list and Click the ![]() button.
button.
|
Note: If the datasets are part of a data plot group, the dataset names are prefaced with a gn notation, where n is the group number (see explanation under the Group/Ungroup). |
Right click on the column header area of this list to view a context menu:
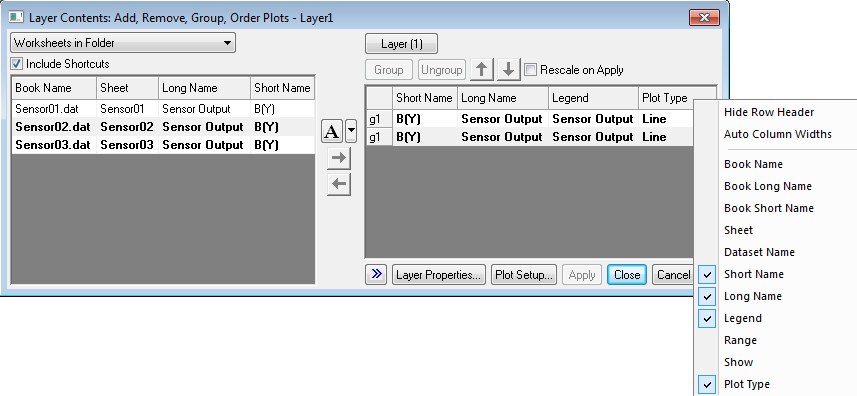
| Hide Row Header | Check this item to hide the row header |
| Auto Column Widths | Check this item to auto-adjust the column widths |
| Book Name | Check it, if there is book long name, show long name of the book. If there is no book long name, show short name of the book. |
| Book Long Name | Specify if show the book long name in a column. |
| Book Short Name | Specify if show the book short name in a column |
| Sheet | Specify if show the sheet name. |
| Dataset Name | Specify if show the dataset name. |
| Long Name | Specify if show the dataset long name. |
| Short Name | Specify if show the dataset short name. |
| Legend | Specify if show the legend text of datasets. |
| Range | Specify if show the plot range of datasets. |
| Show | Add a column contains Show check boxes to specify if show the dataset in the graph. |
| Plot Type | Check this box to allow user to change Plot Type from the drop-down list . |
Entries in the context menu can be used to customize the columns to be displayed in this list box. Options include Data Range which will display the row index range of the plot, and Plot Type. Click and drag column headers to rearrange the order of columns displayed in the list box.
Click on individual row entries under the Plot Type column to view a drop-down list of available plot types. Select from the drop-down list to change the current plot type. Note that for grouped plots only one drop-down will be available, allowing you to change the plot type of all members of the group simultaneously.
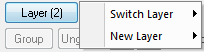
Click this button to switch to another layer or add a new layer.
Situations where you would use these buttons:
For information on plot groups and incrementing plot properties, see:
The plot drawing order is determined by the order of the datasets in the right panel of Layer Contents. Drawing order might affect how one plot obscures another, or the order in which increment lists are applied. Use these buttons to move individual or grouped datasets up or down and change the plotting order.
or
or
Click on one of the grouping identifiers, eg., g1, within the group and keep mouse click pressed to drag that group up and down to desired place.
Click the Layer Properties button to open the Plot Details dialog box with the layer n icon selected in the left side of the dialog box. Edit the tabs in this dialog box to control layer properties.
Click the Plot Setup button to open the Plot Setup dialog box.
The Plot Setup dialog box provides an advanced interface for adding or removing datasets from your graph windows. This dialog allows adding datasets to plots without the need to change column Plot Designations.
To learn more about the Plot Setup dialog, see these topics in help page: