
If you plot 3D or Contour graph from a virtual matrix in worksheet, a virtual matrix will be generated. You can use Tools: Virtual Matrix Manager or type run.section(file, VMManager) in Command Window or Script Window to bring up Virtual Matrix Manager dialog to manage the existing virtual matrices.
Display a list of all the virtual matrices. You can select to customize a particular virtual matrix.
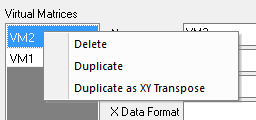
The right-click menu allows you to delete or duplicate the selected virtual matrix, and duplicate it as a XY-transposed virtual matrix.
| Name | Specify or change the name of the selected virtual matrix. |
|---|---|
| Z Title | Specify or change the long name of current virtual matrix. You can click the arrow button to select the information of the source worksheet from the fly-out list as the Z title, just like that in plotvm dialog. |
| X Title | Specify or change the name of the X axis. ou can click the arrow button to select the information of the source worksheet from the fly-out list as the X title, just like that in plotvm dialog. |
| X Data Format | Set the data format for X axis. Click the button |
| Y Title | Specify or change the name of the Y axis. ou can click the arrow button to select the information of the source worksheet from the fly-out list as the Y title, just like that in plotvm dialog. |
| Y Data Format | Set the data format for Y axis. Click the button |
Show X, Y and Z data range.
Click this button ![]() to open the worksheet where current virtual matrix is.
to open the worksheet where current virtual matrix is.
List the related graphs about current virtual matrix. Double-click on the graph name or click on the Go to Graph button ![]() to go to the graph.
to go to the graph.
| Note: You can go to Virtual Matrix Manager from the Plot Details dialog of the Graph by click Workbook button. |