8.8.1 Adding Labels to Plots
Labelling-DataPoint
After creating a graph, you might need to add labels to annotate the plot elements. The dialog/tools below can be used to do this task
Adding Labels with Label tab of the Plot Details dialog
You can use the Label tab of the Plot Details dialog to add labels to all points or specified points of a data plot. This Label tab can be found on the right side of the Plot Details dialog when a data plot icon is selected on the left panel.
To add labels using Plot Details controls
- Double-click on the data plot you want to label.
- On the Plot Details dialog that opens, make sure the data plot icon is selected on the left side of the dialog and go to the Label tab on the right side of the dialog.
- Select the Enable check box.
- Note that for some plot types, you can opt to Show at Specified Points Only and enter a space-separated set of point indices in the text box. Use keyword "Begin" to label only the first point and keyword "End" or "0" to label the last point in the plot.
- Use the Label Form list with the Numeric Display Format and Format String to construct your label. Note that there is a Label Form = Custom option that allows you to label points with worksheet and project metadata.
- Customize other label-related settings as needed (font, color, rotation, offsets, position, auto-reposition, leader lines, etc) using Label tab controls; or close the Plot Details dialog and customize labels using buttons on the data label Mini Toolbar or the Style and Format toolbars.
For help with specific Label tab controls, see:
| Note: Values in a pre-designated Origin Label column or in an Excel worksheet column can be used to label data points in a graph. Labeling points in this way is an older method and it remains primarily for backward compatibility. In earlier versions of Origin, designated Label columns appeared as a separate dataset in Plot Details. Beginning with Origin 2020b, designated Label columns will simply be treated as a display option of the data plot and will be controlled via a common Label tab.
|
Adding Labels with Mini Toolbar
Using Show Data Labels button
Since Origin 2020, we have introduced the context-sensitive Mini Toolbars for faster graph customization. You can also use the controls on it to label the data points:
- To quickly add and remove labels for the plot group and a single plot, click on one plot, and on the pop-up Mini Toolbar,
- under the Group tab
 , click the Show Data Labels button
  to add and remove labels for all plots in current group. By default, the Y values of data points will show as labels.
- under the Single tab
 , click the Show Data Labels button to add and remove labels for all plots of current plot. By default, the Y values of data points will show as labels.
- To quickly add a single data label in your graph, press CTRL + click to select a single point (symbol, bar, etc.), then on the Mini Toolbar click the Show Data Labels button . By default, the Y value of this data point will show as label.
- To quickly customize a single data label, press CTRL + click on a single label. Use available buttons to customize the label.
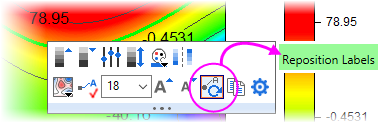
- When labeling a contour plot, click on the plot and click the Show Contour Labels button . If you use the Scale In button
 to change the axis scales (i.e. you zoom in), click the Pointer button
  then click again on your contour plot and click Reposition Labels, to redraw labels on the zoomed portion of your plot.
Choose a Label Source
Once you have enabled labels (using either Plot Details Label tab controls or the Mini Toolbar Show Data Labels button), you need to specify a Label Source:
- If you are labeling entire plots, chances are you will use plot data to label your plot. You can select the labels and click the Label Source button
 on the Mini Toolbar, to designate a label source (X, Y, XY, etc.).
- If you are labeling a single point, you may want to use plot data, column label row data, or you may wish to create a Custom data label using LabTalk substitution.
- To access the full range of label customization options, double-click on the label(s) or click on the Open Plot Details button
 to open Plot Details.
Adding Labels with Text or Annotation tool
With the Text tool  in Tools toolbar, you can add text labels anywhere in the graph window, only one label at a time.
With the Annotation tool  in Tools toolbar, you can precise pick and label specific points on 2D and Contour plots.