8.9.3 Inserting Tables in Graphs
Graph-InsertTable
Add a New Link Table
To add an empty table to the Graph window or Layout window:
- Click on the New Link Table button
 on the Add Object to Graph toolbar.
or
- Right-click inside graph layer (or right-click on a blank place in the Layout window) and select New Table... from the context menu.
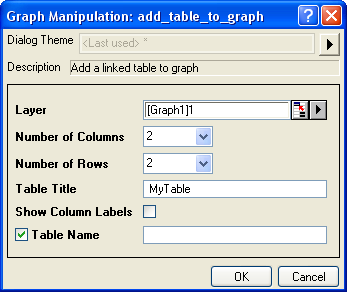
- In the add_table_to_graph dialog that opens, specify the number of columns and rows in the table, the table title, etc. Click the OK button to add this new table to window.
-
- Double-click on the table object to edit. Enter data and style the table using docked toolbars and/or Mini Toolbars.
For more information, please refer to add_table_to_graph X-Function.
Add a table by copy-paste
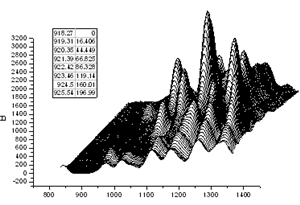
You can copy a range of worksheet values -- including values from an Analysis Report Sheet -- and paste the data into an Origin graph. The embedded table may be formatted for presentation and publication purposes.
- A group of cells from any worksheet, including cells from report tables in an analysis report sheet, can be copied and pasted into a graph as a table.
- Non-contiguous data may be selected by using the CTRL key while selecting cells with your mouse.
- Table contents are dynamically linked to the source data. Changes to the source data will register in the embedded table.
- The table contents can be formatted using the Style and Format toolbar buttons.
- You can insert multiple tables into the graph window.
- Select cells in worksheet or Analysis Report Sheet. To copy an entire report table (from an Analysis Report Sheet), right-click on the table and choose Copy Table.
- To paste the table, click on the target graph or layout page and press CTRL-V or right-click and select Paste, Paste Link or Paste Link Transpose.
Add a report table of analysis results
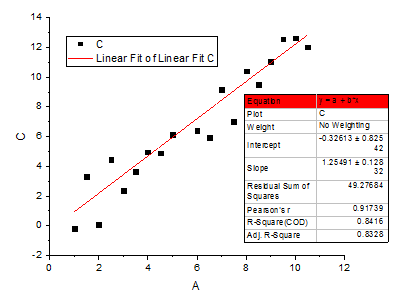
Most of Origin's analysis tools support adding a report table to plots of analysis results (e.g. the Linear Fit tool, Output tab). When adding a report table, the user can customize table content by opening the Quantities in Table dialog and adding, removing, or rearranging quantities.
Once added, the user can continue to customize the report table in the following ways:
- Double-clicking on a report table -- whether in a source graph or a graph embedded in the analysis report sheet -- will open a table window. Here, you can use buttons on the Format and Style toolbars to modify the appearance of the table (hint: be sure to click the template's Update Table button when finished or changes will not be applied).
- Alternately, users of the latest Origin versions can use Mini Toolbar buttons to modify the appearance of the table (hint: click the table to select and the Mini Toolbar will appear).
Additional information is available in the following section on Editing tables.
Editing tables
 | Note that for common stylings, you don't need to double-click on the table open a popup window as described below. Just select the table object in the graph or layout window and use Mini Toolbar buttons to modify the table.
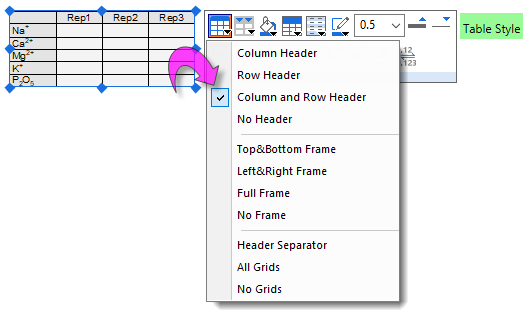
|
To edit an embedded table, double-click on the table. This puts the table into edit mode:
- Copy values from your worksheet or Analysis Report Sheet and Paste or Paste Link data into the table.
- To copy a range of worksheet values, including column label row information, see the GIF below.
- Alternately, type directly into the table cells.
- In this table edit mode, selections can be styled using and the Format and Style toolbars: change the text font, foreground and background colors, increase the grid line weight, etc.
- Once changes are made, be sure to click the popup's Update Table button.
| Support to insert the legend symbol into the table in the graph.
- Open the table edit mode
- Right-click the cells of the table and select Format Cells
- Check Rich Text option in the dialog and click OK.
- Enter the following notation for the plot legend symbol in the cell of the table.
\l(1) // The legend symbol of 1st plot legend
\l(2) // The legend symbol of 2nd plot legend

\l([%H]1!1)// The legend symbol of 1st plot legend in layer 1
\l([%H]1!2)// The legend symbol of 2nd plot legend in layer 1
\l([%H]2!1)// The legend symbol of 1st plot legend in layer 2
\l([%H]2!2)// The legend symbol of 2nd plot legend in layer 2
|