The Statistics Gadget (the addtool_curve_stats X-Function) can be used to obtain basic statistics information on data covered by the rectangle of the Region Of Interest (ROI).
With this gadget you can:
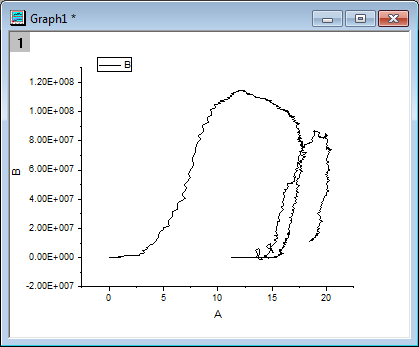
To use this tool, select Gadgets: Statistics from the Origin menu when a graph is active.
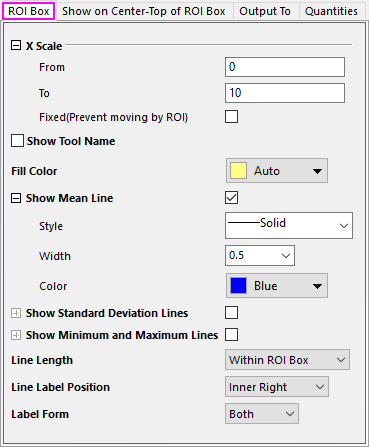
| X Scale (XScale) | Specify the X Data range for the ROI.
|
|---|---|
| Show Tool Name (toolname) | Specify whether to show the tool name in the top-left corner of the rectangle in the graph. |
| Fill Color (rectcolor) | Assign a color to the region-of-interest (ROI). For help with Origin's Color Chooser, see Customizing Data Plot Colors. |
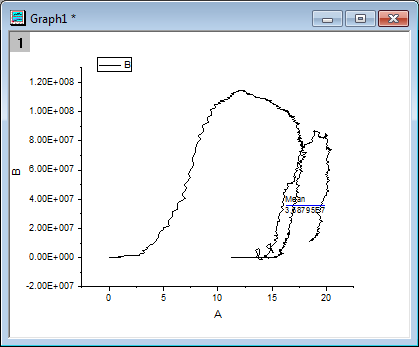
| Show Mean Line (meanline) | Specify whether to show the mean line of the covered data by the rectangle. The default setting is 1.
|
| Show Standard Deviation Lines (sdline) | Specify whether to show the standard deviation line of the covered data by the rectangle. The default setting is 0 (unchecked).
|
| Show Minimum and Maximum Lines (extremumline) | Specify whether to show the minimun and maximum lines of the covered data by the rectangle. The default setting is 0 (unchecked).
|
| Line Length (linelength) | Specify the length of Mean and/or SD line. Options include:
|
| Line Label Position (linelabelpos) | Specify where to put the label of the line. Options include:
|
| Label Form (labelform) |
|
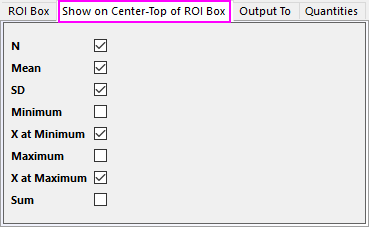
| N (n) | Specify whether to show the number of selected data points at the top of the ROI. The default setting is checked (1). | |||||||||||||||||||||||||||
|---|---|---|---|---|---|---|---|---|---|---|---|---|---|---|---|---|---|---|---|---|---|---|---|---|---|---|---|---|
| Mean (mean) | Specify whether to show the mean value of the selected data points at the top of the ROI. The default setting is checked (1). | |||||||||||||||||||||||||||
| SD (sd) | Specify whether to show the standard deviation of the selected data points at the top of the ROI. The default setting is checked (1). | |||||||||||||||||||||||||||
| Minimum (min) | Specify whether to show the minimum Y value of the selected data points at the top of the ROI. The default setting is unchecked (0). | |||||||||||||||||||||||||||
| X at Minimum (xmin) | Specify whether to show the X coordinate of the minimum data point at the top of the ROI. The default setting is unchecked (0). | |||||||||||||||||||||||||||
| Maximum (max) | Specify whether to show the maximum Y value of the selected data points at the top of the ROI. The default setting is unchecked (0). | |||||||||||||||||||||||||||
| X at Maximum (xmax) | Specify whether to show the X coordinate of the maximum data point at the top of the ROI. The default setting is unchecked (0). | |||||||||||||||||||||||||||
| Sum (sum) | Specify whether to show the sum of the selected data points at the top of the ROI. The default setting is unchecked (0). | |||||||||||||||||||||||||||
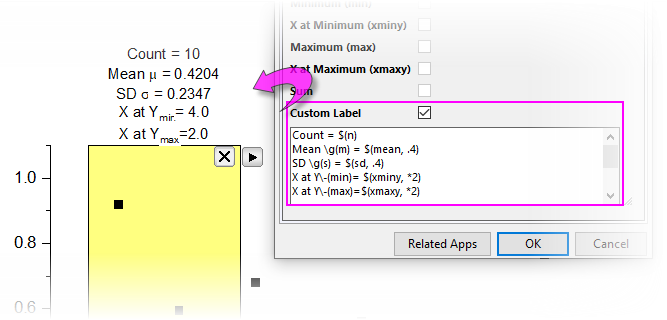
| Custom Label |
Check this box to define a custom label in the accompanying text box.
|
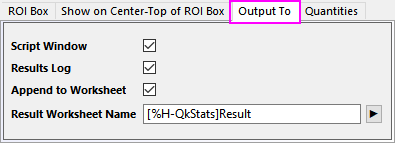
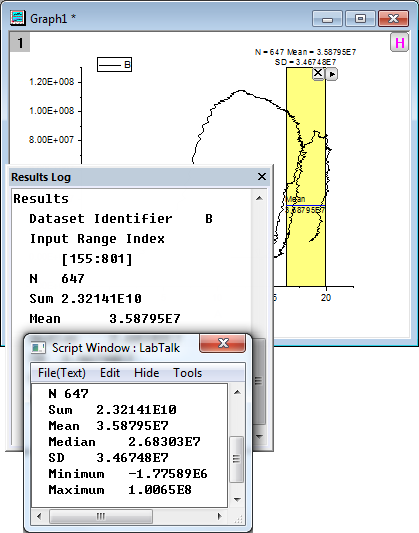
| Script Window (script) | Specify whether to output the results to the Script window. The default setting is checked (1). |
|---|---|
| Result Log (reslog) | Specify whether to output the results to the Results Log. The default setting is checked (1). |
| Append to Worksheet (appendwks) | Specify whether to append the results to a worksheet. The default setting is unchecked (0). |
| Result Worksheet Name
(wksName) |
This is only available when Append to Worksheet (appendwks) is selected. It is used to specify the name of the worksheet:
|
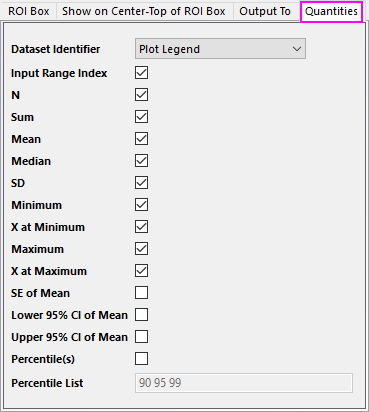
| Dataset Identifier (name) | Specify a dataset identifier in the drop-down list. The default setting is Plot Legend (5). |
|---|---|
| Input Range Index (range) | Specify whether to output the input range index. The default setting is checked (1). |
| N (n) | Specify whether to output the number of input data points. The default setting is checked (1). |
| Sum (sum) | Specify whether to output the sum of the input data range. The default setting is checked (1). |
| Mean (mean) | Specify whether to output the mean of the input data range. The default setting is checked (1). |
| Median (median) | Specify whether to output the median of the input data range. The default setting is checked (1). |
| SD (sd) | Specify whether to output the standard deviation of the input data range. The default setting is checked (1). |
| Minimum (min) | Specify whether to output the minimum Y value of the input data points. The default setting is checked (1). |
| X at Minimum (xmin) | Specify whether to output the X coordinate of the minimum data point. The default setting is unchecked (0). |
| Maximum (max) | Specify whether to output the maximum Y value of the input data points. The default setting is checked (1). |
| X at Maximum (xmax) | Specify whether to output the X coordinate of the maximum data point. The default setting is unchecked (0). |
| SE of Mean (sem) | Specify whether to output the Standar Error of mean. The default setting is unchecked (0). |
| Lower 95% CI of Mean (LCL) | Specify whether to output the lower limit of the 95% confidence interval of mean. The default setting is unchecked (0). |
| Upper 95% CI of Mean (UCL) | Specify whether to output the upper limit of the 95% confidence interval of mean. The default setting is unchecked (0). |
| Percentitle(s) (percentile) | Specify whether to output the custom percentiles. The percentile value can be typed in Percentile List combo box below. The default setting is unchecked (0). |
| Percentile List (percentileList) | Specify the custom percentile values. Allow space separated numbers. The default setting is 90 95 99. |
| New Output (0) | Output the new results. The destination of the output is specified on the Output To tab of the Statistics Preferences dialog. |
|---|---|
| Go to Report Worksheet | Activate the report worksheet, if there is one. |
| Output to Clipboard | When selected (menu item checked) New Output will be placed on the Clipboard. |
| Tag Lines | Add the shown lines(mean line and SD line) as line object. And the label attach to the line will be added as text object which can be deleted or modified. Close the gadget will not delete the line and text. |
| Change Data | Change the source data set. This is applicable only when there are multiple curves on the graph layer. By default, all plots in current layer will be selected. Change fitting data/plot. By default, all plots in current layer will be selected.
|
| Expand to Full Plot(s) Range | Expand the ROI box to full plot range. |
| Fix ROI Position | Fix the ROI position, then you cannot move it any more. |
| Save Theme | Save theme for the dialog settings. |
| Save as <default> | Save the current dialog settings as default theme. |
| Load Theme | Load the existed theme to apply the dialog settings. |
| Preferences | Open the Statistics Preferences dialog, which is similar to the one when starting the gadget by selecting menu Gadgets: Statistics. |
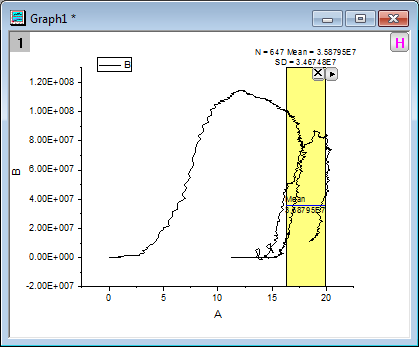
To toggle the display of all gadget ROI boxes in a graph at the same time, click the H button |
This tool is designed to perform descriptive statistics on a curve in the graph window. For more information about calculation, please refer to the algorithm of X-Function stats.