This page provides a simplified description of the most commonly used controls in Export Graph dialog. For a more detailed description of the controls, please refer to [[UserGuide:Settings_in_Export_Graph_Dialog|Settings in The Export Graph Dialog Box]].
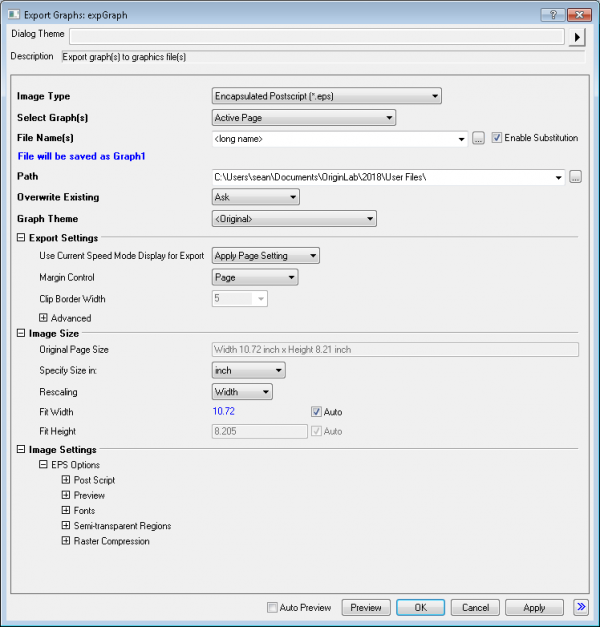
| Image Type |
Select the desired export image type from this drop-down list. Note that the list is organized alphabetically and provides a wide selection of vector and raster formats. For information on choosing a format, see Which Format Should I Choose? |
|---|
| Select Graph(s) |
Select the page(s) to be exported.
|
|---|
This option is only available when there are multiple graph pages selected to export as a PDF file.
Check this box to export the multiple graph pages to one PDF file with multi-pages.
| Note: By default, the PDF page size fits to the dimension of the graph in Origin (system variable @MPGS= 1). |
This option is only available when there are multiple graph pages selected to export as a TIF file.
Check this box to export pages to a single TIF image (TIF stack).
To export a Browser Graph as GIF, TIF stack, or AVI, use Flip Through to export. |
| File Name(s) |
Specify the name(s) for the exported image file(s).
|
|---|---|
| Enable Substitution |
When the box is checked, LabTalk substitution is supported for specifying the File Names. A hint text is displayed below File Name(s), displaying the substituted string that will be used for the file name. |
Note:
|
| Path |
The file path to save the exported image file(s).
|
|---|
| Overwrite Existing |
Specify whether to overwrite the existing file(s)
|
|---|
| Graph Theme |
Optionally select a graph theme to be applied "on the fly" when exporting the graph. The theme will not affect the existing graph page(s). For example, you can select the B&W Publication theme to convert your graphs to black and while while exporting, without changing any colors in the existing graph page. |
|---|
| Use Current Speed Mode Display for Export |
|
|---|---|
| Margin Control |
This drop-down controls what area of the graph window will be exported. In the text below, graph page area refers to the page size settings in the Printing/Dimensions tab of the Plot Details dialog. For more details on use of these settings, see The Copy/Export Page settings group.
†Note: Starting with Origin 2018, you can both (1) view the bounding box and (2) affect the size of the bounding box, using the Export Margin Offset dialog box. |
| Clip Border Width |
Only available when Border is selected for Margin Control. Specify the border width to be added to the export area. The value is in percentage of the width of the bounding box. |
| Advanced |
These settings apply ONLY to vector export formats. It is recommended that you leave these settings at their default values, unless you find issues with the exported image such as skewed or stretched symbols, improperly sized columns or bars, and improper text label spacing.
|
These settings determine the size of the exported image.
| Original Page Size |
This non-editable control displays the original size of the graph page. |
|---|---|
| Clipped Page Size |
This non-editable control displays the clipped page size when Margin Control under Export Settings is set to any option other than the full page. |
| Specify Size in |
Use this drop-down to set output size in inches, cm, pixels, or ratio of original page size. |
| Rescaling/Fit Width/Fit Height |
This is useful when exporting graph to meet specification of a journal, such as scale image to 1-column or 2-column width for the journal, in inches or centimeters. |
| Ratio(%) | This is available if size is specified as a ratio. Set a percentage ratio to scale the page as desired. |
This controls in this node will vary depending on the chosen export image type. Each image type such as EPS, PDF or TIFF have their own set of controls, which are documented in detail in this page.
Listed below are some of the most relevant controls for a few of the popular export formats.
| Preview | Since most applications (including MS Office applications) are incapable of displaying an EPS file, users may opt to generate a "preview" TIFF or WMF image when exporting to EPS. |
|---|---|
| Fonts |
|
| Semi-transparent Regions (EPS) | Use these settings if you have a applied transparency to some portion of your graph. |
| DPI Resolution |
Specify the resolution of the exported raster image in dots per inch. Note that if you set a large value such as 600 or 1200, you may want to then scale down the output width or height using the controls under the Image Size node, to limit the size of the exported file. For example, if the publisher requires a 1200 DPI file, they may only require the width to be 3.25 inches. |
|---|---|
| Color Space | Generally, you would choose RGB for graphs to be rendered on a computer display and CMYK for graphs intended for print. |
| Color Depth | This setting will matter most to those who are concerned about file size (particularly for TIFF files, which can be quite large). To limit file size, reduce the color depth. |
| Compression | Both TIFF and JPEG formats offer compression options but only TIFF offers "lossless" compression (LZW, Packbits) |
If your Image tab Preview appears blank, you are likely viewing only a corner of a very large raster image. Starting with Origin 2019, you can right-click in the Image tab and choose a zoom level for previewing your raster or vector images. By manipulating the size of the Preview panel + the Image tab zoom level, you'll be able to view your entire graph. |