Select at least one column to create Wilkinson dot plots or histogram dot plots.
To create a Dot Plot:
statdot.optu (installed to the Origin program folder)
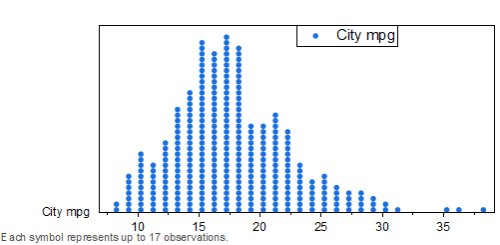
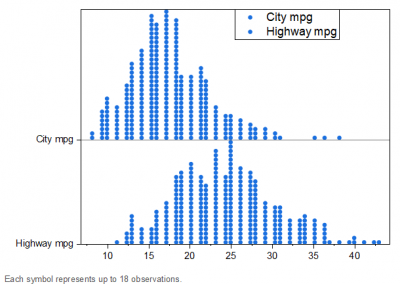
When you select multiple input columns, each column will be plotted as a dot plot arranging points from the base line and these dot plots will be stacked on Y axis.
| Minimum Version: Origin 2025 |
More detials, please refer to the Creating Dot Plot page.