17.2.12 Creating Dot Plot
Create-Dot-Plot
Dot Plot is a statistical chart consisting of data points plotted on a fairly simple scale, typically using filled in circles.
Origin supports to plot the dot plot from the Plot menu:
Dot Plot Types
|
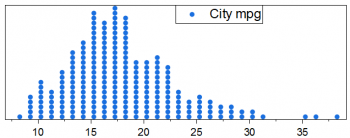
Dot Plot of One Y
|
Input: One Y column
Menu: Plot > Statistical : Dot Plot
|
|
Dot Plot of One Y With Groups
|
Input: One Y column and One Grouping column
Menu: Plot > Categorical : Grouped Dot Plots
|
|
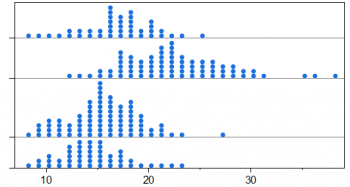
Dot Plot of One Y With Stacked Groups
|
Input: One Y column and Two Grouping columns
Menu: Plot > Categorical : Grouped Stacked Dot Plots
|
|
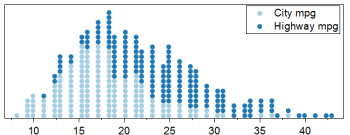
Dot Plot of Multiple Ys
|
Input: Multiple Y columns(2 Columns in This Example)
Menu:Plot > Statistical : Dot Plot
|
|
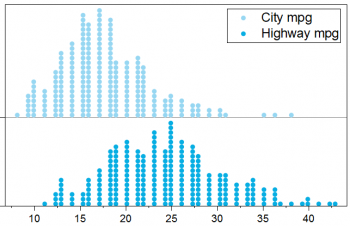
Dot Plot of Multiple Ys, Stacked
|
Input: Multiple Y columns(2 Columns in Example)
Menu: Plot > Statistical : Stacked Dot Plots
|
|
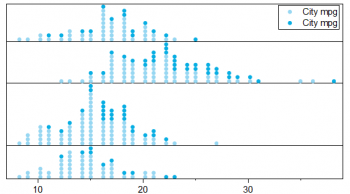
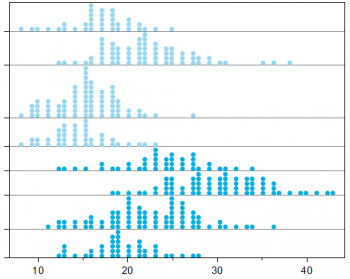
Dot Plot of Multiple Ys, With Groups
|
Input: Multiple Y columns(2 Columns in Example) and One Grouping column
Menu: Plot > Categorical : Grouped Dot Plots
|
|
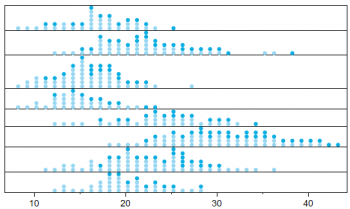
Dot Plot of Multiple Ys, With Stacked Groups
|
Input: Multiple Y columns(2 Columns in Example) and Two Grouping columns
Menu: Plot > Categorical : Grouped Stacked Dot Plots
|
Creating Dot Plots
When you plot a Dot Plot with groups, the X-function plot_gdot will open to let you decide how to plot the dots:
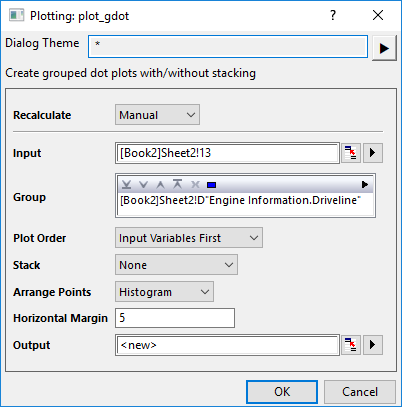
Input
Select the source Y data column for counting. You are allowed to select multiple columns.
Group
Select the grouping column(s).
Plot Order
Specify how to sort the data in Output sheet and plot grouped dot plots when there are multiple Input columns. This control is same as Sort Output Columns By in the Unstack Columns dialog.
It will be disable when Stack control is set to Input Variable, Last Group or All Groups. Because selecting Stack Input Variable will use Group Info First; selecting Last Group or All Groups will use Input Variable First.
Stack
Specify whether stack the dot plots and how to stack them in each group.
- When Stack is None, split source input variable data using group columns, plot all of them as grouped dot. When Input is multiple variables+groups, if Plot Order is Input Variable First, set subgroup to last group label row in the Output sheet; If Plot Order is Group Info First, set subgroup to Long Name row in the Output sheet. When Input is one variable+multiple groups, set subgroup to last group label row in the Output sheet.
- When Stack is Input Variable/Last Group/All Group, split source input variable data using group columns, plot all of them as grouped dot. Select Cumulative for Stack, and set Subgrouping to By Column Label and Column Label is the user parameter of last group/the group above last group/Long Name in the Output sheet.
- When Stack is All, same as Input Variable/Last Group/All Group, but without setting Subgrouping.
Arrange Points
Specify how to arrange the dots:
- Density: The point will be arranged as that in a column scatter, but the points will be aligned to base line of each plot. Actually there is no bin for data, the data arrangement relate to size of data point.
- Histogram: Just like a histogram plot, but show number of points instead of bars. It will split the data by bins, count the points in each bin, and then plot symbols from base line according to the count.
This control is same as Arrange Points control in Data Tab of Plot Details.
Horizontal Margin
Specify the horizontal margin to fit page to layer, for making the tick labels show well especially when there are multiple table rows on Y axis.
Output
Output the unstacked input columns using specified grouping column(s).
Customizing Dot Plots
Once you created a dot plot, you can customzie the dot plot with Plot Details dialog:
And you can also click the plot element to customize it with Mini toolbar.