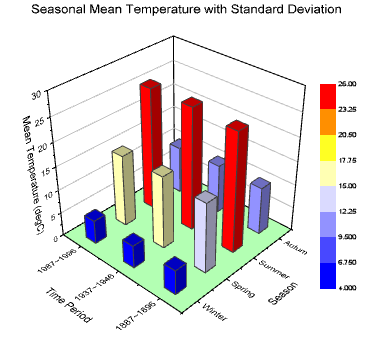
29.17.5 3D Bar Graph
3D-Bars
Data Requirements
- Select at least one Z column (or a range from at least one Z column). If the Z column has associated XY columns, then the XY columns are used; otherwise, the worksheet's default XY values are used.
- or
or
- Matrix: A matrix of Z values.
Creating the Graph
Activate the matrixsheet or select required data from worksheet.
From the menu, for worksheet data, choose ; for matrix data, choose .
or
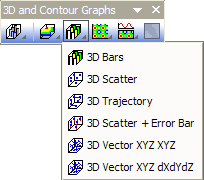
Click the 3D Bars button on the 3D and Contour Graphs toolbar.
Template
- gl3DBARS.OTP (OpenGL)
- 3DBARS.OTP
(Installed to the Origin program folder).
Notes
- The Z values determine the height of the columns (bars). The columns/bars can be color-mapped to the Z values.
- The associated X and Y values mapped in the matrix/worksheet determine the XY locations of each column.
- When the Z value is missing for an XY pair, you can opt to plot the missing bar (i.e. plot the empty space) by unchecking the Ignore Missing Data for Column/Bar Width box (Display tab, page-level of Plot Details). Supported in Origin 2021b and later. For earlier versions (Origin 2017 SR1 - Origin 2021), try setting system variable @OGLBWF = 3.
- Since Origin 2018, if you have set any plot attribute(such as border color, fill color) to be indexed to a categorical data, then you are allowed to add a categorical legend to enumerate one or multiple attributes.
- Since Origin 2018b, you are allowed to add special points for a 3D XYZ bar graph, by double-clicking on a bar with the key Ctrl key pressed. Once the special points added, you can go to the Pattern and Label tab to do the customization.