1.22 FAQ-134 How do I show the data values on my bar or column graph?
Show-Data-Values-on-Bar
Last Update: 4/9/2020
By Mini Toolbar
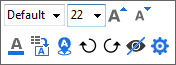
- Click on the plot, and then click on Show Data Labels button
 in the popup Mini Toolbar.
- Click on the labels, and then you can customize the label format and label from in the Mini Toolbar for the labels.
By Plot Details dialog
- Double-click on the bars or columns in your graph and the Plot Details dialog will open.
- Go to the Label tab and check the Enable checkbox.
- Select an option from the Label Form drop-down list.
Keywords:label, y-values,