3.3 X-Function ReportTree Example
Summary
In this example, we will show how to do statistics on the selected data in a worksheet, and generate a report in a new hierarchy sheet. The selected data can be one column, multiple columns, or any one subrange in the worksheet.
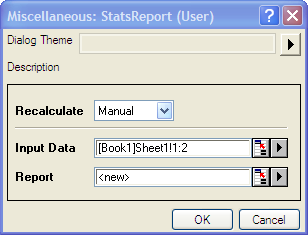
As the output data type is ReportTree, the dialog will have a Recalculate combo box, which can set the recalculate mode of the report sheet to "Manual", "Auto Update" or "None".
You will learn
- How to get data from the selected data range.
- How to do error handling in event1, before_execute and the main function.
- How to generate report tables in a hierarchy sheet with a recalculation lock.
Steps
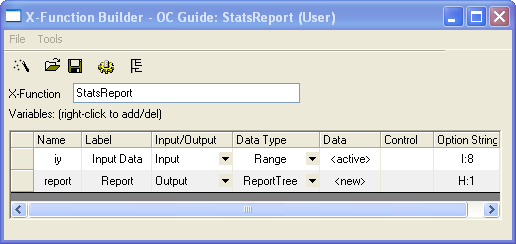
- Hit F10 to open X-Function Builder, enter the X-Function name and variables, as in the following picture, and then click Save.
 .
.
- Open this X-Function in Code Builder to edit the source code. First include the needed header file, as below.
#include <ReportTree.h> // needed for ReportTable class
- Add error checking code into StatsReport_event1 to check the input data range, like in the following.
DataRange drInput;
drInput.Create(trGetN.iy.strVal);

// if input is invalid, show error message
// on the bottom of dialog
// and disable OK button
if ( !drInput.IsValid() || drInput.GetNumRanges() < 1 )
{
	strErrMsg = "Please select valid data for input";
	bOKEnable = false;
}
- Add error checking code in report_stats_before_execute.
DataRange drInput;
drInput.Create(trGetN.iy.strVal);

// if input is invalid, print out error message
// and abort the X-Function execution
if ( !drInput.IsValid() || drInput.GetNumRanges() < 1 )
{
	out_str("Invalid Input Data");
	nRet = XFEVT_ABORT;
}
- Add a static function to check the input range after the line //put your own support static functions here
static	bool	_check_input(const Range& iy)
{
	int nRanges;

	if ( !iy.IsValid() )
		return false;

	nRanges = iy.GetNumData(DRR_COLUMN_INDEX |
 	                        DRR_NO_FACTORS);

	if ( nRanges <= 0 )
		return false;
	return true;
}
- Add any needed macros under the static function. The macros will be used in the X-Function main function.
// ID can be any value, but must be unique.
#define	TABLE_ID_BEGIN		0x1000
#define	ROW_ID_BEGIN		0x0001
- In the X-Function main function StatsReport, add the following code to get the data from the specified data range, do statistics, and generate a report sheet.
if ( !_check_input(iy) )
{
	// if input is not valid,
	// show error message and
	// abort X-Function execution.
	XF_THROW("Invalid input data");
	return;
}

//create table to show statistics summary.
ReportTable rt = report.CreateTable("Summary",_L("Summary"),
                                    TABLE_ID_BEGIN);

//report table's column headers.
const vector<string> vsColLabels = {
	"N",
	"Number of Missing",
	"Mean",
	"SD",
	"SEM",
	"Sum",
	"Variance"
};
int nRowID = ROW_ID_BEGIN;
int nRanges = iy.GetNumData(DRR_COLUMN_INDEX |
                            DRR_NO_FACTORS);

for ( int nRange = 0; nRange < nRanges; nRange++ )
{
	// get the subrange - one column
	DataRange drOne;
	iy.GetSubRange(drOne, DRR_COLUMN_INDEX |
                       DRR_NO_FACTORS, nRange);

	// get range string, like [Book1]Sheet1!A
	string strDataLabel;
	drOne.GetRangeString(strDataLabel);

	vector vInput;
	drOne.GetData(&vInput, 0);
	if ( vInput.GetSize() == 0 )
	{
		// print out warning message when column is empty
		// and then go to the next column
		warning_msg_box(
                   strDataLabel + ", empty column found.",
                   false, 'W');
		continue;
	}

	int N, Missing;
	double dMean, dSum, dVariance, dSD, dSE;
	int nRet = ocmath_basic_summary_stats(vInput.GetSize(),
			vInput,
			&N, &dMean, &dSD, &dSE, &dVariance, &dSum,
			NULL, NULL, NULL, NULL, NULL, NULL, &Missing);
	if ( STATS_NO_ERROR != nRet )
	{
		// print out warning message when
		// statistics function failed.
		warning_msg_box(
                   strDataLabel + ", statistics fails.",
                   false, 'W');
		continue;
	}

	vector vResults(vsColLabels.GetSize());
	vResults[0] = N;
	vResults[1] = Missing;
	vResults[2] = dMean;
	vResults[3] = dSD;
	vResults[4] = dSE;
	vResults[5] = dSum;
	vResults[6] = dVariance;

	//add new row to report table.
	string strName = "Data" + nRange;
	rt.AddRow(strName, vResults, strDataLabel,
	          vsColLabels, NULL, nRowID++);
}
Run the X-Function
Keep one Worksheet active with some data, highlight two columns, and type StatsReport -d in the Script Window to open the X-Function dialog.
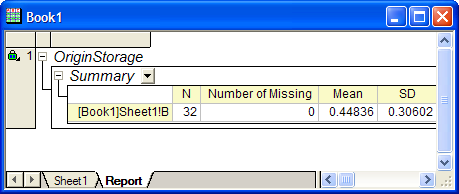
Click OK , and a new report sheet will be generated.