2.14.2.29 pemp_slideshow
Contents
Menu Information
Highlight and right click on the graphs in the Project Explorer: Slide Show of Graphs
Brief Information
Slideshow of specific graphs within Origin
Additinal Information
Minimum Origin Version Required: 8.1 SR0
Command Line Usage
pemp_slideshow end:=hold timer:=1 period:=2;
X-Function Execution Options
Please refer to the page for additional option switches when accessing the x-function from script
Variables
| Display Name |
Variable Name |
I/O and Type |
Default Value |
Description |
|---|---|---|---|---|
| End of Show Options | end |
Input int |
|
Specify the operation to perform after the whole slide show is run.
Option list:
|
| Automatic Show with Timer | timer |
Input int |
|
Specify whether to automatically show the next graph with timer. |
| Timer Period (sec) | period |
Input double |
|
It works only when Automatic Show with Timer has been selected. It specifies the duration time (in seconds) for each slide. |
| Info Line | info |
Input int |
|
Specify the position to show the information about the current graph, which includes the path and the name of the graph.
Option list:
|
Description
This X-Function is used to start a slide show for the selected graphs. Each graph will be shown as one slide. The order of show is the slide order (which can be seen in the Project Explorer) of the graphs.
Examples
This example is used to show four selected graphs in full screen.
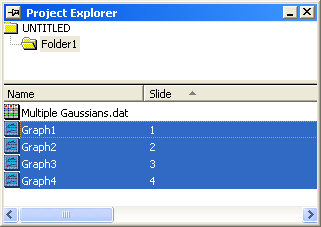
- Create a new project and import the data <Origin Program Directory>\Samples\Curve Fitting\Multiple Gaussians.dat.
- Highlight column B and select Plot > Basic 2D : Line to create Graph1.
- Repeat step 2 to create Graph2, Graph3 and Graph4 with column C, D and E respectively.
- In the Project Explorer, press the Ctrl key on the keyboard and click Graph1, Graph2, Graph3 and Graph4 to select them simultaneously.
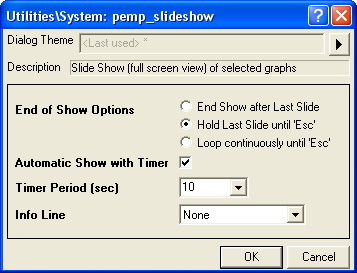
- Run
pemp_slideshow -d;in the command window to bring up the dialog. - In the dialog, select Hold Last Slide until 'Esc' in End of Show Options. Check the check box after Automatic Show with Timer and Timer Period (sec) set to 10. In Info Line drop-down list, select None.
- Click the OK button, then the four selected graphs will be shown in full screen automatically by the period of 10 seconds.