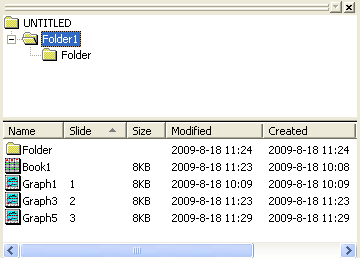
Right-click on the folder in Project Explorer: Slide Show of Graphs
Slideshow of graphs within Origin
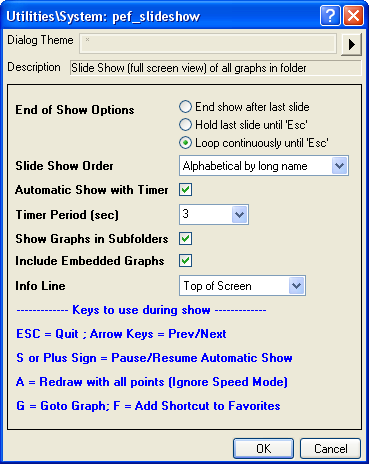
pef_slideshow end:=1 timer:=1 period:=2;
Please refer to the page for additional option switches when accessing the x-function from script
| Display Name |
Variable Name |
I/O and Type |
Default Value |
Description |
|---|---|---|---|---|
| End of Show Options | end |
Input int |
|
Specify the operation to perform after the whole slide show is run.
Option list:
|
| Slide Show Order | order |
Input int |
Specify the order of graphs in the slide show.
Option list:
| |
| Automatic Show with Timer | timer |
Input int |
|
Specify whether to automatically show the next graph with timer. |
| Timer Period (sec) | period |
Input double |
|
It is available only when Automatic Show with Timer has been selected. It specifies the time (in seconds) a graph appears on the screen before the function switches to the next graph. |
| Show Graphs in Subfolders | recursive |
Input int |
|
Specify whether to show the graphs in subfolders. |
| Include Embedded Graphs | embed |
Input int |
|
Specify whether to export embedded graphs to PowerPoint slides. |
| Info Line | info |
Input int |
|
Specify the position to show the information about the current graph, which includes the path and the name of the graph.
Option list:
|
This X-Function can be used to start a slide show for graphs in a specified folder. It enables you to control over the presentation. You can set the graph order, decide whether and how to automatically run the slide show.