2.5.23 laymplot
Contents
Brief Information
Move plot(s) from the active layer to another layer
Additional Information
Minimum Origin Version Required: 2017 SR1
Command Line Usage
1. laymplot plot:="2 4" show:=1 rescale:=both; //Move second and forth plot in current layer to a new layer with X linked and Y independent.
X-Function Execution Options
Please refer to the page for additional option switches when accessing the x-function from script
Variables
| Display Name |
Variable Name |
I/O and Type |
Default Value |
Description |
|---|---|---|---|---|
| Plot to Move | plot |
Input string |
|
Specify the index of the data plot which you want to move. If the plot has been grouped with other plots, this plot will be moved out of the group first. If you want to move multiple plots at the same time, enter their plot indices with space as the separator. |
| Target Layer | target |
Input int |
|
Specify the index of the target layer to which you want to move the plot. The default value 0 means to move the plot to a new right-Y layer. |
| Layer Setting | axis |
Input int |
|
This option is only available when Target Layer is set to 0. Specify how to link the axes of the new layer and active source layer.
Option list:
Note: the position of independent X/Y axis bases on the current X/Y axis position of active layer. If the active layer has both X and Y axes, the top X/right Y axis of the newly added layer will have 11% offset to the rightmost/topmost axis of the active source layer. |
| Show Linked Axis for Both Sides | show |
Input int |
|
Specify whether to show the linked axis on both sides. For example, if you link the X axes of new layer to the active source layer straightly, with this check box checked, both the bottom and top x axes will be shown. |
| Rescale Layer | rescale |
Input int |
|
Specify which layer you want to rescale.
Option list:
|
Description
This X-Function is used to move the specified plot(s) from active layer to an existing layer or new layer.
Example
- Create a new workbook. Click the button
 to import the file <Origin Program Folder>/Samples/Import and Export/S15-125-03.dat.
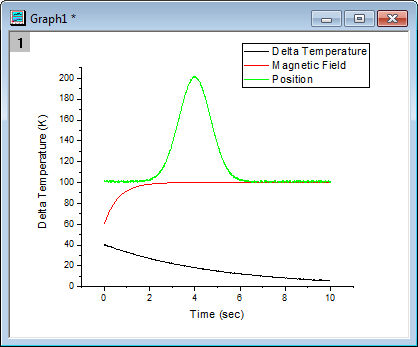
 - Highlight all columns and plot a line graph by selecting Plot>2D: Line: Line menu. The graph has three curves within one layer. Please note that these three curves are grouped by default, which increments the line colors.
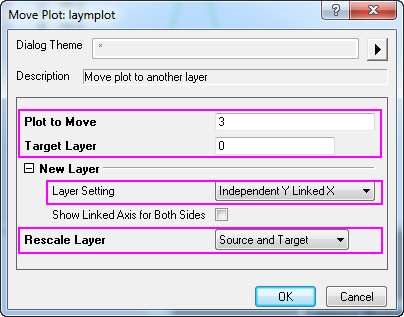
- Now we are going to move the third curve to a new layer which links X axis to Layer1 and has independent Y axis. Run
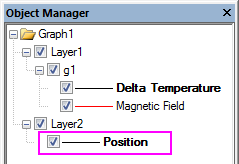
laymplot -d;in Script Window to open the laymplot dialog. Set as below: - Click OK to close the dialog. The 3rd plot is moved out of the group and inserted to a new layer. In Object Manager which is docked at the right side of workspace by default, you will see the 3rd plot has been moved out from the group g1 in layer 1, and belongs to layer 2(the new one) now. The line color is black.
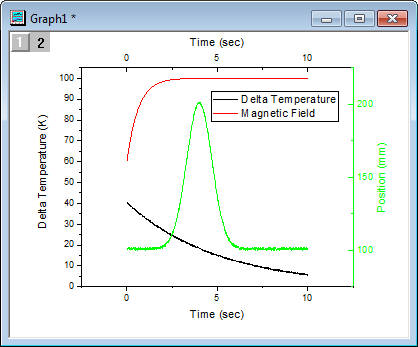
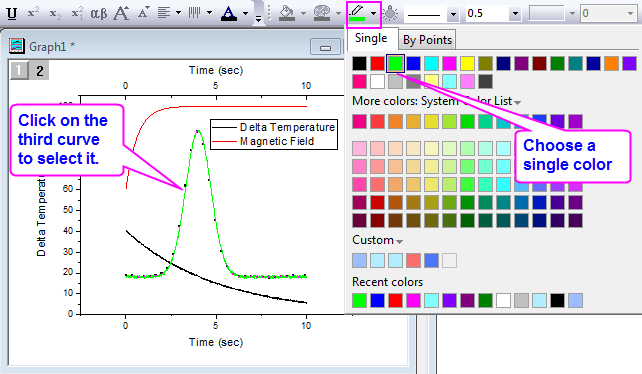
- click on the 3rd curve in graph window to select it, use the Line/Border Color button in the Style toolbar to change its color to green.
- Double-click on the second Y axis(the right one) we just added to open the Axis dialog.
- On Line and Ticks tab, set Line Color as Auto;
- On Title tab, set Color to Auto; *On Tick Labels tab, select Format sub-tab, change Color to Auto.
Then the second Y axis's elements will follow the color of the third curve(the moved one).