2.5.18 laycolor
Contents
Brief Information
Set graph layer colors
Command Line Usage
1. laycolor layer:="1:4" color:=2;
2. laycolor igp:=graph1 layer:=1 color:=8 border:=1;
X-Function Execution Options
Please refer to the page for additional option switches when accessing the x-function from script
Variables
| Display Name |
Variable Name |
I/O and Type |
Default Value |
Description |
|---|---|---|---|---|
| Input Graph | igp |
Input GraphPage |
|
Specifies the graph to be manipulated. |
| Layer | layer |
Input string |
|
Specifies the layer(s), whose background color is to be changed. Note: to specify multiple layers, use colon to separate the first layer and the last layer to be manipulated. For example, "1:3" means the first, second and the third layer. |
| Color | color |
Input int |
|
Specifies the color used to fill the layer background. |
| Fill | fill |
Input int |
|
Specifies the color used to fill the space between background and borderline. |
| Border | border |
Input int |
|
Specifies the color of the borderline of the layer. |
Description
This X-Function can be used to fill the layer background with a chosen color.
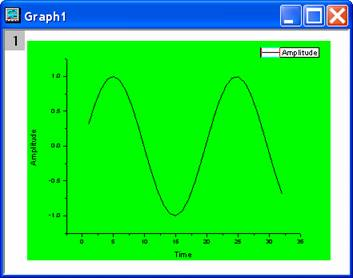
The background color can be extended to the layer borders, if the fill and border are set to be the same with color. In this case, the labels and axes titles area of the layer is also filled with the chosen background color, as shown in the below screenshot:
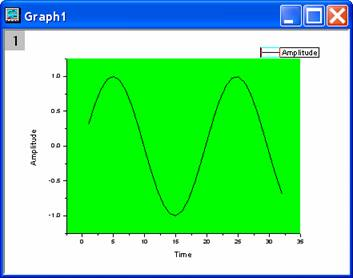
Otherwise, only the area within the axes is filled, as shown below:
Examples
- Code Sample
/*
In this example, we use laycolor to set layer background color.
1. Import a sample data.
2. Plot the data.
3. Set graph background color.
4. Set layer background color.
*/
//Create a new workbook
newbook;
//Import a file
path$ = system.path.program$ + "Samples\Curve Fitting\";
fname$ = path$ + "Gaussian.dat";
impasc;
//Plot the data
plotxy col(2);
//Set graph color
Page.basecolor=color(blue);

//Set layer color
laycolor color:=color(white) fill:=color(198, 236, 255) border:=color(black);
Related X-Functions
Keywords:fill, background, border