2.8.12 interp1trace
Contents
Menu Information
Analysis: Mathematics: Trace Interpolation
Brief Information
Perform trace/periodic interpolation of XY data
Command Line Usage
1. interp1trace iy:=Col(2) method:=spline npts:=50;
2. interp1trace iy:=Col(2) method:=bspline;
X-Function Execution Options
Please refer to the page for additional option switches when accessing the x-function from script
Variables
| Display Name |
Variable Name |
I/O and Type |
Default Value |
Description |
|---|---|---|---|---|
| Input | iy |
Input XYRange |
|
The XY range to be interpolated. |
| Method | method |
Input int |
|
Specifies the interpolation method.
|
| Number of Points | npts |
Input int |
|
Specifies the number of interpolated points. If npts is not specified, default <auto> = min( n*5, 1000), where n is the number of input points. i.e. if number of points n is less than 200, npts=5*n, otherwise npts=1000. |
| Output | oy |
Output XYRange |
|
The XY range of interpolation result. See the syntax here. |
Description
When a curve is cyclic, or periodic, it is improper to use ordinary interpolation because the algorithm interpolates the curve based on adjacent data points in the X coordinate. This causes the cycle trend to be lost.

This function interpolates a curve and keeps the trend.
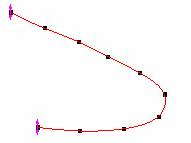
Examples
1. Import the file \Samples\Mathematics\ Circle.dat.
2. Highlight the data and plot a scatter.
3. Select Analysis: Mathematics: Trace Interpolation from menu to bring up the dialog.
4. Select Cubic B-spline interpolating method, and enter 50 on the Number of Points edit box.
5. Click OK to execute.
Algorithm
Detail algorithms please refer to the help of interp1.
Related X-Functions
interp1, interp1q, spline, bspline, interp1xy, interpxyz
Keywords:interpolate, extrapolate