22 Origin Toolbars
This is a list of Origin toolbars, and buttons by button group. Toolbars are shown in their default configurations. You will note that some buttons are missing from default toolbar configurations. This may be because a button has been deprecated, because it is duplicated on another toolbar, or simply because it is a lesser-used button.
To add or remove buttons from a toolbar:
- Click View: Toolbars to open the Customize dialog box.
- Click on the Button Groups tab and drag desired buttons to a toolbar or to an empty portion of the workspace.
- To remove a button/toolbar, drag it from the toolbar back to the Buttons list or click the small "x" in the upper right-corner of the toolbar (removes entire toolbar from the workspace).
Note also that some toolbar buttons have a small downward pointing arrow next to them. Clicking the tool displayed on these "split buttons" carries out the action associated with the displayed tool. Clicking the arrow beside it opens a menu, allowing you to pick another tool. A split button displays the tool that was last used.
To hide/show all toolbars in the Origin interface:
- Click View: Hide Toolbars menu
or - Press the hotkey Ctrl+Alt+R
Finally, toolbar buttons will be inaccessible (dimmed) if the object that they act on is not active. For instance, the 3D-Rotation Toolbar is only available when a 3D graph is active.
 | In addition to these dockable toolbars, Origin has context-sensitive Mini Toolbars for variety of common editing tasks. These toolbars are discussed in The Origin Interface chapter of this Guide. For a complete list of those toolbars, see the Origin Help File. |
Contents
Standard

| Button | Description | Hotkey | Button | Description | Hotkey |
|---|---|---|---|---|---|

|
New Project | 
|
New Folder | ||

|
New Workbook | 
|
New Graph | ||

|
New Matrix | 
|
New 2D (Function) Plot | ||

|
New 2D Parametric Plot | 
|
New 3D (Function) Plot | ||

|
New 3D Parametric Plot | 
|
New Layout | ||

|
New Notes | 
|
Digitize Image | ||

|
New Image | 
|
Open | Ctrl + O | |

|
Open From Cloud | 
|
Save Project | Ctrl + S | |

|
Save Template |  
|
Recalculate Auto/Up-to-date vs Manual/Pending | ||

|
Pause Auto Update/Recalculation | 
|
Zoom In and Out by Percentage | ||

|
Ctrl + P | 
|
Slide Show of Graphs | ||

|
Send Graphs to PowerPoint | 
|
Open Video Builder | ||

|
Refresh | F5 | 
|
Duplicate | |

|
Custom Routine | 
|
Project Explorer | Alt + 1 | |

|
Object Manager | Alt + 8 | 
|
Results Log | Alt + 2 |

|
Command Window | Alt + 3 | 
|
Script Window | Shift + Alt + 3 |

|
Code Builder | Alt + 4 | 
|
Add New Columns |
Folders and Windows
Folders and Windows toolbar is added for working with Project Explorer folders and folder contents. It should be helpful when dealing with multiple project folders and when needing to compare windows in separate folders.
When first running Origin, you may see this toolbar "floating" in the Origin workspace. You can drag it (by the title bar) to an empty portion of the toolbar spacer; or you can choose View: Toolbars and click the Reinitialize button to reset toolbars to the standard configuration.
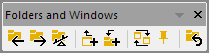
| Button | Description | Hotkey | Button | Description | Hotkey |
|---|---|---|---|---|---|

|
Folder Backward | 
|
Folder Forward | ||

|
Seesaw | Ctrl + Alt + X | 
|
Add Active Window Shortcut for Seesaw | Ctrl + Shift + F7 |

|
Add Shortcuts from Previous Folder | 
|
Arrange Windows (Last Used) | ||

|
Pin Active Window |
Import

| Button | Description | Hotkey | Button | Description | Hotkey |
|---|---|---|---|---|---|

|
Import Wizard | 
|
Import Single ASCII | ||

|
Import Multiple ASCII | 
|
Import Excel | ||

|
Re-import no Dialog | Ctrl + 4 | 
|
Re-import with Dialog | |

|
Clone Import | 
|
Batch Processing | ||

|
Connect to Data from Web | 
|
Connect Multiple Files | ||

|
Import All Connected Data |
Edit
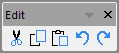
| Button | Description | Hotkey | Button | Description | Hotkey |
|---|---|---|---|---|---|

|
Cut | Ctrl+X | 
|
Copy | Ctrl+C |

|
Paste | Ctrl+V | 
|
Undo | Ctrl+Z |

|
Redo | Ctrl+Y |
Graph

| Button | Description | Hotkey | Button | Description | Hotkey |
|---|---|---|---|---|---|

|
Enable/Disable Anti-Aliasing | 
|
Rescale | Ctrl+R | |

|
Rescale X | 
|
Rescale Y | ||

|
Rescale XY | 
|
Rescale Z | ||

|
Exchange the X and Y axes | 
|
Enable/Disable Speed Mode | ||

|
Extract to Layers | 
|
Extract to Graphs | ||

|
Merge | 
|
Duplicate with New Columns/Sheets/Books | ||

|
Add Bottom-X Left-Y Layer | 
|
Add Top-X Layer | ||

|
Add Right-Y Layer | 
|
Add Top-X Right-Y Layer | ||

|
Add Inset Graph | 
|
Add Inset Graph With Data | ||

|
Zoom In | 
|
Zoom Out | ||

|
Whole Page |
2D Graphs
| Note that only common plot types have a toolbar button. Complete access to Origin plot types is found on the Plot menu. |

| Button | Description | Button | Description |
|---|---|---|---|

|
Line | 
|
Horizontal Step |

|
Vertical Step | 
|
Spline Connected |

|
Scatter | 
|
Grouped Scatter - Indexed Data |

|
Scatter Central | 
|
Column Scatter |

|
Y Error | 
|
X Y Error |

|
Vertical Drop Line | 
|
Bubble |

|
Color Mapped | 
|
Bubble + Color Mapped |

|
Line + Symbol | 
|
Line Series |

|
2 Point Segment | 
|
3 Point Segment |

|
Row-wise | 
|
Column |

|
Column + Label | 
|
Grouped Column-Indexed Data |

|
Bar | 
|
Stacked Column |

|
Stacked Bar | 
|
100% Stacked Column |

|
100% Stacked Bar | 
|
Floating Column |

|
Floating Bar | 
|
3D Color Pie Chart |

|
2D B&W Pie Chart | 
|
Double Y Axis |

|
3Ys Y-YY | 
|
3Ys Y-Y-Y |

|
4Ys Y-YYY | 
|
4Ys YY-YY |

|
Multiple Y Axes | 
|
Stacked Lines By Y Offsets |

|
Colormapped Line Series | 
|
Waterfall |

|
Y Color Mapped Waterfall | 
|
Z Color Mapped Waterfall |

|
3D Waterfall | 
|
Y Color Mapped 3D Waterfall |

|
Z Color Mapped 3D Waterfall | 
|
Vertical 2 Panel |

|
Horizontal 2 Panel | 
|
4 Panel |

|
9 Panel | 
|
Stack |

|
Multiple Panels by Label | 
|
Trellis Plot |

|
Cluster Plot | 
|
Box Chart |

|
Violin with Box | 
|
Grouped Box Charts-Indexed Data |

|
Grouped Box Charts-Raw Data | 
|
Interval Plot |

|
Histogram | 
|
Histogram + Probabilities |

|
Multi-Panel Histogram | 
|
Marginal Histograms |

|
Marginal Boxes | 
|
Distribution + Rug |

|
2D Kernel Density | 
|
QC(X-bar R) Chart |

|
Pareto Chart-Binned Data | 
|
Pareto Chart-Raw Data |

|
Scatter Matrix | 
|
Probability Plot |

|
Q-Q Plot | 
|
Parallel Plot |

|
Area | 
|
Stacked Area |

|
Fill Area | 
|
Zoom |

|
Polar theta(X) r(Y) | 
|
Polar r(X) theta(Y) |

|
Wind Rose-Binned Data | 
|
Wind Rose-Raw Data |

|
Ternary | 
|
Piper |

|
Smith Chart | 
|
Radar |

|
Vector XYAM | 
|
Vector XYXY |

|
High-Low-Close | 
|
Japanese Candlestick |

|
OHLC Bar Chart | 
|
OHLC-Volume |

|
Line (Stock) | 
|
Bridge Chart |

|
Template Library |
Add Object to Graph
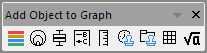
| Button | Description | Hotkey | Button | Description | Hotkey |
|---|---|---|---|---|---|

|
Add Color Scale | 
|
Add Bubble Scale | ||

|
Add Box Scale | 
|
Reconstruct Legend | Ctrl+L | |

|
Add Asterisk Bracket | 
|
Add Round Bracket | ||

|
Add Brace Bracket | 
|
Add XY Scale | ||

|
Date & Time | 
|
Project Path | ||

|
New Link Table |
3D and Contour Graph
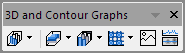
| Button | Description | Button | Description |
|---|---|---|---|

|
3D Scatter Plot | 
|
3D Trajectory |

|
3D Scatter + Error Bar | 
|
3D Vector XYZ XYZ |

|
3D Vector XYZ dXdYdZ | 
|
3D Tetrahedral |

|
3D Bars | 
|
3D Stacked Bars |

|
3D 100% Stacked Bars | 
|
XYY 3D Bars |

|
XYY 3D Stacked Bars | 
|
XYY 3D 100% Stacked Bars |

|
3D Ribbons | 
|
3D Walls |
|
|
3D Waterfall |
|
Y Color Mapped 3D Waterfall |
|
|
Z Color Mapped 3D Waterfall | 
|
3D Color Fill Surface |

|
Multiple Color Fill Surfaces | 
|
3D X Constant with Base |

|
3D Y Constant with Base | 
|
3D Colormap Surface |

|
Multiple Colormap Surfaces | 
|
3D Color Fill Surface with Error Bar |

|
3D Colormap Surface with Error Bar | 
|
3D Wire Frame |

|
3D Wire Surface | 
|
3D Colormap Surface with Projection |

|
3D Ternary Colormap Surface | 
|
Contour - Color fill |

|
Contour - B/W Lines + Labels | 
|
Gray Scale Map |

|
Contour Profiles | 
|
Polar Contour theta(X) r(Y) |

|
Polar Contour r(X) theta(Y) | 
|
Ternary Contour |

|
Image Plot | 
|
Image Profiles |

|
Heatmap | 
|
Heatmap with Labels |
3D Rotation

| Button | Description | Button | Description |
|---|---|---|---|

|
Rotate counterclockwise | 
|
Rotate clockwise |

|
Tilt left | 
|
Tilt right |

|
Tilt down | 
|
Tilt up |

|
Increase perspective | 
|
Decrease perspective |

|
Fit frame to layer | 
|
Reset Rotation |

|
Reset | 
|
Rotate on any direction |

|
Rotation Angle |
Worksheet Data

| Button | Description | Hotkey | Button | Description | Hotkey |
|---|---|---|---|---|---|

|
Statistics on Column(s) | 
|
Statistics on Row(s) | ||

|
Sort | 
|
Set Column Values | Ctrl+Q | |

|
Set All Column Values | Ctrl+F5 | 
|
Row number | |

|
Uniform random numbers | 
|
Normal random numbers | ||

|
Add/Remove Data Filter | 
|
Enable/Disable Data Filter | ||

|
Reapply Data Filter |
Column

| Button | Description | Button | Description |
|---|---|---|---|

|
Set as X | 
|
Set as Y |

|
Set as Z | 
|
Set as Y Error Bars |

|
Set as Labels | 
|
Set as Disregard |

|
Set as Grouping | 
|
Set as Subject |

|
Move to First | 
|
Move Left |

|
Move Right | 
|
Move to Last |

|
Swap Columns | 
|
Add Sparkline |
Layout
This toolbars has been hidden in the workspace by default. To show it, select menu View: Toolbars.

| Button | Description | Button | Description |
|---|---|---|---|

|
Add Graph | 
|
Add Worksheet |
Mask
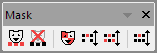
| Button | Description | Button | Description |
|---|---|---|---|

|
Mask Range | 
|
Unmask Range |

|
Change mask color | 
|
Hide/Show masked points |

|
Swap mask | 
|
Disable/Enable masking |
Tools
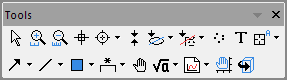
| Button | Description | Hotkey | Button | Description | Hotkey |
|---|---|---|---|---|---|

|
Pointer | 
|
Scale In | ||

|
Scale Out | 
|
Screen Reader | ||

|
Data Highlighter | 
|
Data Reader | ||

|
Data Cursor | 
|
Data Selector | ||

|
Selection on Active Plot | 
|
Selection on All Plots | ||

|
Mask Points on Active Plot | 
|
Mask Points on All Plots | ||

|
Unmask Points on Active Plot | 
|
Unmask Points on All Plots | ||

|
Draw Data | 
|
Text Tool | ||

|
Annotation | 
|
Distance Annotation | ||

|
Angle Annotation | 
|
Arrow Tool | ||

|
Curved Arrow Tool | 
|
Line Tool | ||

|
Polyline Tool | 
|
Curve Tool | ||

|
Freehand Draw Tool | 
|
Rectangle Tool | ||

|
Circle Tool | 
|
Polygon Tool | ||

|
Region Tool | 
|
Zoom-Panning Tool | Hold "A" | |

|
Insert Equation | 
|
Insert Word Object | ||

|
Insert Excel Object | 
|
Insert Object | ||

|
Insert Graph | 
|
Insert Worksheet | ||

|
Rescale Tool | Hold "Z": Zoom; Hold "X": Pan | 
|
Rotate Tool | Hold "R" |
Object Edit

| Button | Description | Button | Description |
|---|---|---|---|

|
Left | 
|
Right |

|
Top | 
|
Bottom |

|
Vertical | 
|
Horizontal |

|
Uniform Width | 
|
Uniform Height |

|
Group | 
|
Ungroup |

|
Distribute Selected Layers/Graphic Objects Evenly in Vertical Dimension |

|
Distribute Selected Layers/Graphic Objects Evenly in Horizontal Dimension |

|
Front | 
|
Back |

|
Forward | 
|
Backward |

|
Front(data) | 
|
Back(data) |
Arrow
This toolbars has been hidden in the workspace by default. To show it, select menu View: Toolbars.
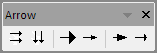
| Button | Description | Button | Description |
|---|---|---|---|

|
Horizontal Alignment | 
|
Vertical Alignment |

|
Widen Head | 
|
Narrow Head |

|
Lengthen Head | 
|
Shorten Head |
Style

| Button | Description | Hotkey | Button | Description | Hotkey |
|---|---|---|---|---|---|

|
Fill Color | 
|
Line/Border Color | ||

|
Lighting Control Dialog | 
|
Palette | ||

|
Line/Border Style | 
|
Line/Border Width | ||

|
Fill Pattern | 
|
Fill Pattern Width | ||

|
Pattern Color | 
|
Clear Borders | ||

|
Left Border | 
|
Top Border | ||

|
Right Border | 
|
Bottom Border | ||

|
Frame Borders | 
|
Inside Horizontal Borders | ||

|
Inside Vertical Borders | 
|
Inside Horiz and Vert Borders | ||

|
All Horizontal Borders | 
|
All Vertical Borders | ||

|
All Borders | 
|
Merge cells | Ctrl+R |
Format

| Button | Description | Hotkey | Button | Description | Hotkey |
|---|---|---|---|---|---|

|
Font | 
|
Font size | ||

|
Bold | Ctrl+"B" | 
|
Italic | Ctrl+"I" |

|
Underline | Ctrl+"U" | 
|
Superscript | Ctrl+"+" |

|
Subscript | Ctrl+"=" | 
|
SuperSubscript | Ctrl+"-" |

|
Increase Font | Ctrl+">"
Ctrl+Shift+"." |

|
Decrease Font | Ctrl+"<"
Ctrl+Shift+"," |

|
Greek | Ctrl+"G" | 
|
Left | |

|
Center Horizontal | 
|
Right | ||

|
Top | 
|
Center Vertical | ||

|
Bottom | 
|
Font Color |
Auto Update

| Button | Description |
|---|---|
|
|
Pause Auto Update/Recalculations |
Database Access
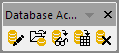
| Button | Description | Button | Description |
|---|---|---|---|

|
Open SQL Editor | 
|
Open Query Builder |

|
Load ODQ File | 
|
Preview Import |

|
Import data | 
|
Remove SQL |
Markers & Locks
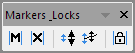
| Button | Description | Hotkey | Button | Description | Hotkey |
|---|---|---|---|---|---|

|
Add Data Markers | Ctrl+Alt+M | 
|
Clear Data Markers | Ctrl+Alt+N |

|
Marker Size | 
|
Marker Hide Show | ||

|
Lock Positions |