14 Data Analysis
Contents
- 1 Introduction
- 2 Data Input
- 2.1 Selecting Data in the Worksheet
- 2.2 Selecting Data in the Graph
- 2.2.1 The Data List and the Active Data Plot
- 2.2.2 Customizing X scale range using Analysis Dialog "Rows" controls
- 2.2.3 Customizing X scale range using Axis Scale Mini Dialog
- 2.2.4 Selecting data graphically using The Regional Data Selector
- 2.2.5 Editing a Data Marker
- 2.2.6 Difference between Data Markers and Analysis Markers
- 2.2.7 The Pick Points Tool
- 2.2.8 The Data Highlighter
- 3 Data Output
- 4 Data Masking
- 5 Mathematics
- 6 Curve Fitting
- 7 Peak Analysis
- 8 Signal Processing
- 9 Image Processing
- 10 Topics for Further Reading
Introduction
Origin contains powerful tools for all of your data analysis needs, including curve fitting, statistics, peak analysis and signal processing. Most of Origin's analysis tools can make use of a stored collection of settings -- something known as a Dialog Theme -- that makes repeat analyses a snap. Furthermore, the output from one operation can become the input for another operation, thus allowing you to set up a chain of operations, with results that update whenever there are changes to source data, as would happen when importing a series of data files.
The following sections cover (1) selecting the data that you wish to analyze and (2) the Origin and OriginPro tools available for analyzing that data. Please refer to the How to Handle Repetitive Tasks chapter of this User Guide for more information on Analysis Templates, Dialog Themes and other time-saving features.
Apps are add-on tools that extend Origin's graphing and analysis capabilities. Many analysis-related tools are available free-of-charge from OriginLab's File Exchange. To find out more about Apps in Origin, see the Apps for Origin chapter of this User Guide. |
Data Input
Origin's analysis tools will work with workbook, matrix and/or graph data, depending upon the tool. By default, analyses will be on done on selected data (note that in the case of matrix data, "selected data" will the the matrix sheet or matrix object, depending on the analysis). When working with worksheet or graph data, you may want to restrict your analysis to a subset of the data -- say, a certain range of rows or columns in a worksheet or a certain X range in a graph.
Data selections can be made before or after opening an analysis dialog. Most of Origin's X-Function based analysis tools have a Input branch with a range selection control that you can use to interactively select your data (as explained below).
Selecting Data in the Worksheet
When you highlight a range of worksheet data, then open one of X-Function based dialog boxes -- that would include nearly all of those that open from the Analysis or Statistics menus -- you will see your range selection already entered into the dialog box Input branch. Most will find that selecting worksheet data prior to opening an Analysis or Statistics dialog box, is the easiest way to specify which data you wish to analyze.
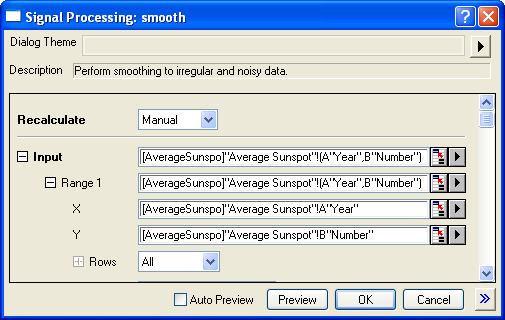
If you open one of the X-Function dialog boxes without pre-selecting your data, the first thing you should do upon opening the dialog is to select data in Input branch:
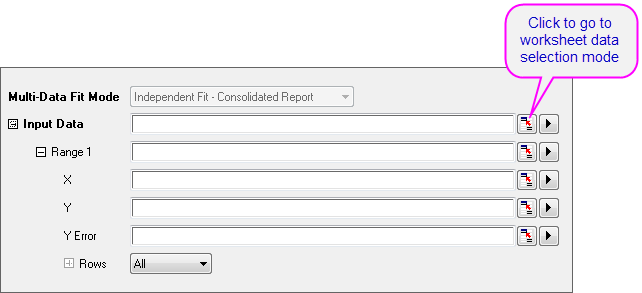
- Click the range selection control next to Input (or Input Data). The dialog box will roll up.
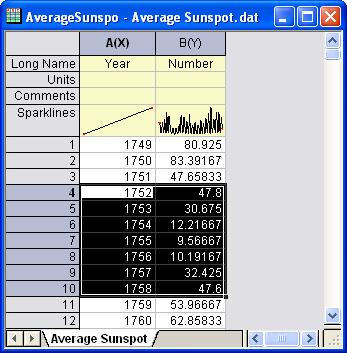
- Go to worksheet and highlight your worksheet data, then click the
 button at the right end of the rolled up dialog box. The Input branch will now show the selected range.
Note that you do not have to select entire datasets (columns). You can select a portion of your worksheet data and analyses will be confined to that selected subset of your data. Also if the analysis supports multiple datasets, you could support multiple ranges such as multiple Y columns or Y ranges. If the analysis only supports one dataset, you may be able to select multiple ranges in the worksheet, but only the 1st range will be picked in the analysis.
Notes
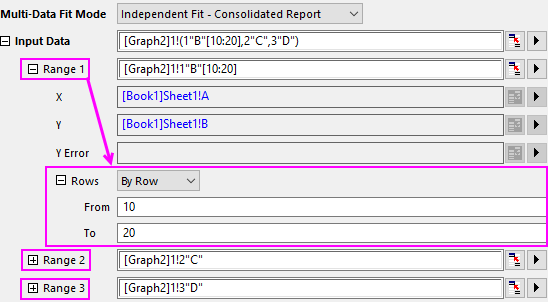
- The Input Data branch has a hierarchical structure. If the analysis supports multiple datasets, you can add multiple ranges under Input Data and they will show as Range 1, Range 2, etc., each with its corresponding X, Y, Error and Row controls.
- Mousing over each level will show a tooltip indicating where the data on that level is from (i.e. book, sheet and column).
- A Rows control under each range node lets you set range by row index or X value. If you want to apply the same row range to all ranges under Input Data, click the arrow button to the right of the range node and choose Apply Row Range to All.
- Depending on where you are in the Input Data hierarchy, the range selection button may have some limitations ( e.g. if you click range selection control next to Y, though you could select multiple columns in a worksheet, only the 1st column is accepted).
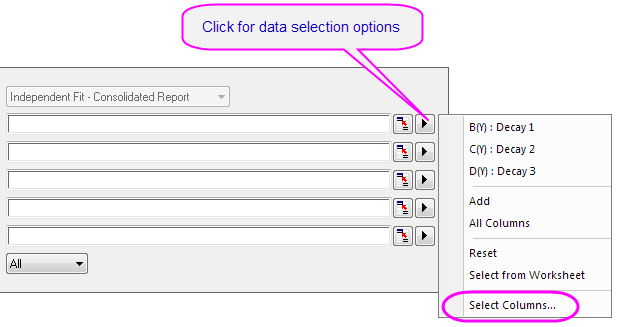
- Clicking the arrow button to the right of the range selection control will show more selection options, including individual worksheet columns that can be quickly added to your data selection.
- Depending on which level you are in, the selection options when clicking the arrow button may vary. For instance, clicking the "arrow" button next to Input Data and clicking the Select Columns... menu item, will open the Column Browser allowing you to select multiple columns from different worksheets.
- Use the List Datasets drop-down list to filter which sheets you want to pick from. The top panel list can be sorted by clicking any of the column headings, making it easy to select, for example, all columns that share the same LName or Comments.
- Then click the Add button to add the column to your selection list in bottom panel.
- To modify the data input range of any dataset, click the range button to the right of any dataset added to the bottom panel and edit the From and To values.
Selecting Data in the Graph
When a graph window is active and you select one of the Analysis menu tools, the default behavior is for the analysis dialog box to open showing the selected range of the active dataset as your Input Data (note that analysis dialogs include an Input Data node that allows adjustments -- adding more datasets with the interactive range selector button, changing a data range, etc.).
The Data List and the Active Data Plot
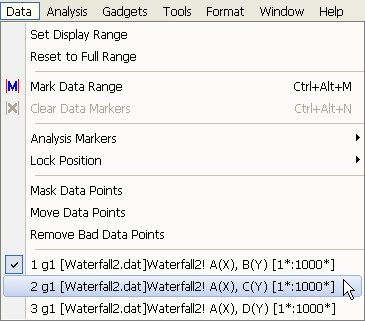
The active data plot is the one that shows in the data list (bottom of the Data menu) with a check mark next to it. If the active graph layer contains a plot group, the default behavior is to make the first plot in the group the active data plot (note the "g1" beside each range in the following image, indicating that all are members of plot group 1). You can activate a different plot by clicking on another of the data plots listed at the bottom of the Data menu. Subsequently, when you open an analysis dialog box, this newly-selected plot will be listed as your input data.
However, for most purposes, you can ignore the data list and select your plot data directly in the graph window or using the Object Manager:
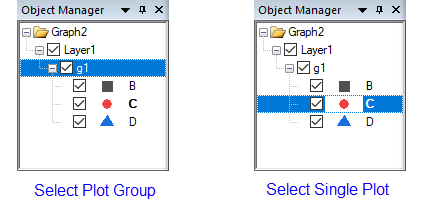
- If your data plots are part of a plot group, select the entire group by pressing SHIFT + clicking on a plot. Alternately, click on the group icon in the Object Manager. Either will set Input Range to all plots in the group.
- To select just a single plot -- whether it be an independent plot or part of a group -- click once on the plot. Alternately, click on the plot icon in the Object Manager. Either will set Input Range to only the selected plot.
You can also indicate the active dataset by placing a red box around the plot's legend entry. In the case of grouped plots, the red box shows on the first plot in the group. To turn this feature on or off:
|
Customizing X scale range using Analysis Dialog "Rows" controls
You can adjust data range using the Rows controls under the Input Data branch of most analysis dialogs. If you have an analysis dialog box open:
- Click on Input Data branch to expand.
- Change the Rows drop-down list to By Row or By X and enter your From and To values. Note that each Range N will have its own Rows controls.
Customizing X scale range using Axis Scale Mini Dialog
Before opening an analysis dialog...
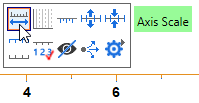
- Click on an axis then click the Mini Toolbar Axis Scale button to open the Axis Scale dialog box.
- Adjust the X axis scale to your desired range.
- Now open your analysis dialog (e.g. Linear Fit) and click the arrow button beside the Input Data box and select Use X Scale Range from the context menu:
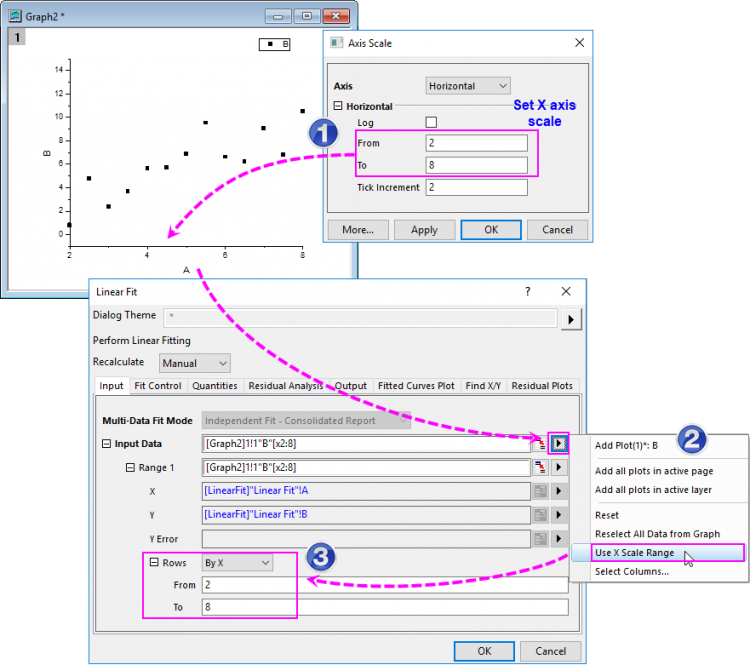
As you can see, the customized scale range of X axis on the graph has been used to specify the input data range for your analysis (Rows = By X).
Selecting data graphically using The Regional Data Selector
You can graphically select a range of data using the Regional Data Selector tool:
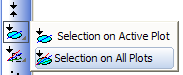
- With a graph window active, click and hold on the Regional Data Selector button
 on the Tools toolbar, and then choose either the Selection on Active Plot or Selection on All Plots button.
 - Drag out a rectangle or freehand object to select an area of the plot(s). Note that you can press Space to toggle between rectangle
 and freehand modes
  .
.
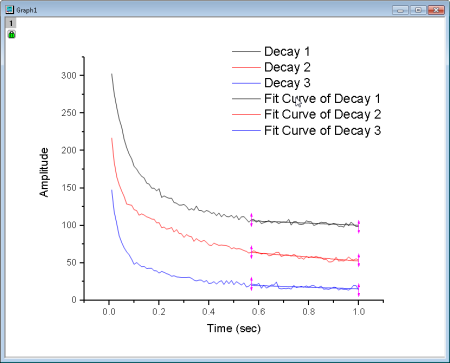
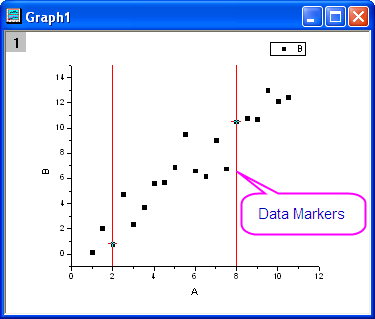
When you make your selection, Data Markers are placed on the graph to mark the selected range(s). You can now use Origin's analysis tools (e.g., Linear Fit) to perform an analysis on the selection, but note that some analysis dialog boxes do not work on multiple data ranges. The smoothing dialog box, for example, (Analysis: Signal Processing: Smooth...) will only smooth data in the active dataset or a single, selected plot.
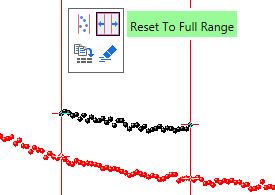
There is a new Mini Toolbar for controlling X scale range when using Data Markers. Click on a Data Marker and use the buttons to Set Display Range or Reset to Full Range. |
Tutorial: Linear Regression on Partial X Range
|
In addition to the data selection and data masking methods discussed in this section, Origin offers data filtering and data reduction tools. Please visit the linked pages for details. |
Editing a Data Marker
To edit a Data Marker:
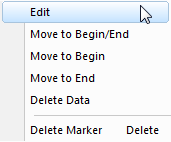
- To modify a data range, right-click a data marker and choose Edit; or double-click on the data marker. The red marker changes to a dark color with arrows on both ends and the cursor changes into a cross-hair. Drag the beginning or ending marker to a new position or use one of the keyboard shortcuts listed below and modify the data range. To escape edit mode, double-click on the marker or press the Enter key.
- There are other options when right-clicking the data marker such as Delete Marker, Delete Data, etc..
| Note: If you have used the Regional Data Selector tool to place markers on multiple plots (Selection on All Plots), be aware that moving markers will affect the data range of the active plot only; the ranges of other selected plots will not follow that of the active plot. This is a limitation of the Regional Data Selector. |
Alternately, you can use these keyboard shortcuts to select and edit data markers:
- Select data markers using these keys ...
Hot Key Action s Select the first pair of data markers on the graph (those marked with "1"). Tab Select the next pair of data markers (not in edit mode) or the other data marker of the pair (in marker edit mode). Home Return to the first data marker. End Go to the last data marker. - ... then activate and edit the data marker using these key combinations:
Hot Key Action Enter Activate the selected data marker for editing. (Press Enter again to exit data selection mode.) Arrow Move the active data marker exactly one data point. Ctrl/Shift + Arrow Move the active data marker multiple data points. Delete Delete the the active data marker.
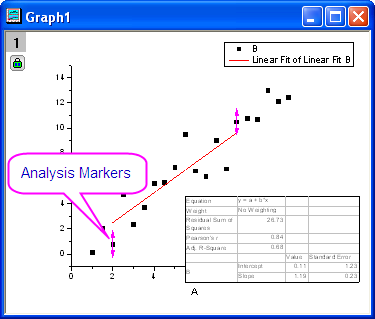
Difference between Data Markers and Analysis Markers
- Data Markers define a sub-range that you select using the Data Selector tool.
If you want to remove the data markers from a graph, you can select Data: Clear Data Markers from the main menu, or click the Clear Data Markers button on the Markers and Locks toolbar.
- When the analysis routine is completed, Data Markers are replaced with Analysis Markers. By default, Analysis Markers will not show if the analysis is done on the entire dataset. If performed on a subrange, Analysis Markers will show at the beginning and end of that subrange. To modify the data range and rerun your analysis, you must right-click an analysis marker and choose Change Parameters.... Change the Input Data range and rerun the analysis.
Note:
|
The Pick Points Tool
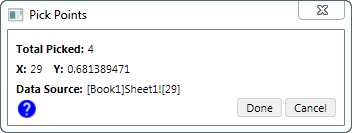
You can also pick the data points in the graph using the Pick Data Points tool. This works best for scatter or line + symbol plots of smaller datasets.
- Select Data: Pick Data Points. The Pick Points dialog will pop up.
- With the square cross-hair, you can read the coordinate of current data points in the Pick Points dialog (also the Data Source). Double-click on the point you want to pick until the cross-hair cursor became round, the actual X&Y values will be recorded and the total number of picked points will be counted up.
- Once you finished the picking, click the Done button to output the results to a new workbook.
The Data Highlighter
In some cases, the Data Highlighter on the Tools toolbar, can be useful for selecting some portion of your data for further analysis. For instance, you have a 2D scatter plot and you are interested in data points in a particular region of the graph.
- Click the the Data Highlighter button
 on the Tools toolbar.
 - Highlight the desired group of data points. Note that you can toggle between rectangular and freehand selection modes by pressing the spacebar while the Highlighter is active. Selection points in the graph simultaneously highlights selected rows in the source worksheet.
- Go the source worksheet, right-click on it and choose Create Subset Sheet.
You now have a secondary worksheet named as wcopyN, that contains only the data points that you selected in the graph.
For more information, see The Data Highlighter Tool.
Data Output
Origin's analysis tools typically have an Output branch (the exact name varies by tool), in which you can specify the output that you wish to generate and where you would like that output to go. This happens to be the output branch of the Integration tool.
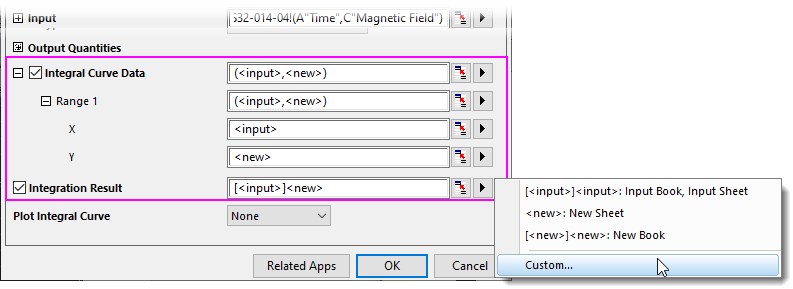
Output can be directed to various places -- a range of worksheet cells or columns, or possibly to a worksheet, a workbook, a matrixsheet, or a graph layer. Output options depend upon the target object as well as the type of window that was active when the tool was opened. You can determine your output target by:
- Typing directly in the associated text box, using a standard range notation
- Selecting data with the interactive range control.
- Type or select your target using a set of predefined range strings.
This being an introductory manual, we will stick with the simplest to use -- using predefined range strings. For information on other options, follow the links above.
Specifying Output Using Range Strings
Referring to the image above, note that range strings are enclosed by < > characters. Valid strings will differ from dialog to dialog (e.g. <source> is available from the Book list under the Output Fitted Values To branch of the Fit Linear dialog, but it is not used to specify Output in the Smooth dialog).
The most common strings:
- <none>: Generate no output.
- <new>: Create a new Origin object -- a column, a worksheet, a graph, etc.
- <input>: Use the input object for output.
You can type these strings directly into the edit box but the easiest thing to do is to just select them from the flyout menu (options will vary by tool). Alternately, you can click the Custom button and open the Range String Builder. Despite the intimidating name, it is just a way to step through the process of specifying your output target. For more information on range strings and Range String Builder, see Output Results in the Origin Help file.
Data Masking
Masking is another technique that you can use when you want to analyze only a subset of your data, or when you have spurious data points that you do not want included in your analysis. Masking or unmasking data will trigger recalculation of linked operations.
- You can mask data points in both worksheets and graphs.
- When data exist in both the worksheet and the graph, masking data in one will mask (and mark) the corresponding data in the other.
- Mask toolbar buttons work on both graphs and worksheets.
- Tools toolbar buttons work on graphs.
- When data are selected in the worksheet, a Mini Toolbar Mask Data button becomes available.
- Additionally, you can mask worksheet data by mathematical condition.
The active worksheet's Masked and/or Unmasked Data Count can be reported to the Status Bar. |
Masking with the Mask Toolbar (worksheet, graph)
These toolbar buttons are used to mask and manipulate masking of selected data. Note that this includes graphs, once data have been selected (see the next section on Tools toolbar buttons for graph selection).
| Action | Toolbar Button | Shortcut Command | Notes |
|---|---|---|---|
| Mask data | Mask: Range | Mask the selected data range. Masked data will display in the mask color. | |
| Unmask data | Mask: Clear Range | Unmask the selected data range. Unmasked points are included in analysis operations and plot "normally". | |
| Swap mask | Mask: Swap | Swap masked and unmasked points in the active dataset. | |
| Change mask color | Mask: Change Color | Change the mask color of the masked data range. | |
| Hide/Show masked points | Mask: Hide | Toggle display of masked points ON and OFF on-screen, and in printed and exported graphs. | |
| Disable masking | Mask: Disable Masking | Toggle the mask ON or OFF for all masked data in the worksheet. When toggled OFF, all data points are analyzed and included in printed and exported graphs. |
Masking with the Tools Toolbar (graph)
There was a change made to the default masking mode, starting with Origin 2021:
|
To mask points, click on the graph window to activate it:
- Choose Data: Mask Data Points from the main menu or click the Mask Points on Active Plot button or Mask Points on All Plots button on the Tools toolbar, then hover on the graph.
- To mask a single point, double click on the point. To mask a region of points, press the Space bar to toggle among masking by row index number, by rectangular region or by freehand region (differences explained below), then drag out a region.
- Once data are masked in the graph, you can use the Mask toolbar buttons, described above.
| Mask Points on Active Plot | Mask Points on All Plots of Active Layer | Purpose |
|---|---|---|
| Mask data points by rectangular region. Only the data points inside the rectangle that you drag out, will be masked. | ||
| Mask data points by freehand region. Only the data points inside the region that you drag out, will be masked. | ||
| Mask data points by row index number. All data points between the lowest and highest selected index numbers are masked regardless of whether they lie inside your rectangle. |
To remove the mask from data points in the graph window:
- Choose either the Unmask Points on the Active Plot
 tool or the Unmask Points on All Plots of Active Layer
  tool on the Tools toolbar.
 - Use the space bar, as needed, to choose points by index, rectangular region or by freehand region, then drag to unmask your data points. The tool will be active until press ESC or click the Pointer
 tool.
tool.
Mask Mini Toolbar Button (worksheet)
When worksheet data are selected -- cells or entire columns -- A Mini Toolbar Mask Data button ![]() becomes available. The button works as a toggle to mask or unmask data within the selection.
becomes available. The button works as a toggle to mask or unmask data within the selection.
Mask Cells by Condition (worksheet)
There is a tool for masking worksheet data values by condition (e.g. <= 0).
- With the data selected (cells or one or more columns), choose Column: Mask Cells by Condition. This opens the colmask dialog.
- Choose your Condition and Value, plus other options as needed and click OK.
Copy Mask Status
Two ways to copy mask status (the masked cells location) to other columns or worksheet.
- menu Edit: Copy: Copy Mask Status.
- menu Worksheet: Copy Columns to, or right click on columns and select from context menu Copy Columns to. This will open the colcopy X-Function. Uncheck Copy Data and check Copy Mask.
Mathematics
Origin provides a number of mathematics tools to perform basic calculations, interpolation, and area or volume calculations.
Basic Math
| Tool Name | Description | Menu Entry |
|---|---|---|
|
|
Analysis:Mathematics (workbook, graph) |
|
|
Analysis:Mathematics (matrix) |
|
|
Analysis:Data Manipulation (workbook, graph) |
|
|
Analysis:Data Manipulation (graph) |
|
|
Analysis:Mathematics (matrix) |
|
|
Analysis:Data Manipulation (graph) |
|
|
Gadgets:Differentiate... (graph) |
|
|
Gadgets:Intersect... (graph) |
|
|
Gadgets:Vertical Cursor... (graph) |
|
|
Analysis:Mathematics (workbook) |
|
|
Analysis:Mathematics (matrix) |
|
|
Analysis:Mathematics (matrix) |
Interpolation
| Tool Name | Description | Menu Entry |
|---|---|---|
|
|
Gadgets:Interpolate... (graph) |
|
|
Analysis:Mathematics (workbook, graph) |
|
|
Analysis:Mathematics (workbook) |
|
|
Analysis:Mathematics (matrix, graph from matrix) |
Area/Volume Calculation
| Tool Name | Description | Menu Entry |
|---|---|---|
|
|
Gadgets:Integrate... (graph) |
|
|
Gadgets:2D Integrate... (graph) |
|
|
Analysis:Mathematics (workbook, graph) |
|
|
Analysis:Mathematics: 2D Volume Integrate (matrix, 3D graph from matrix) or Analysis:Mathematics: Matrix Surface Area (matrix, 3D graph from matrix) |
Curve Fitting
In addition to Origin's built-in curve-fitting tools, there are a number of add-on Apps designed for various curve-fitting operations that are available for free from the OriginLab File Exchange. To find and install these Apps click Analysis: Fitting: Find Apps. The App Center will open, displaying only fitting-related Apps. Browse available Apps and click the Download and Install button ![]() to install an App.
to install an App.
You can use named range values as X "From" and "To" values, initial parameter values, lower and upper bounds and fixed parameter values, in the linear fit, nonlinear fit (NLFit), polynomial fit and multiple linear regression dialog boxes. |
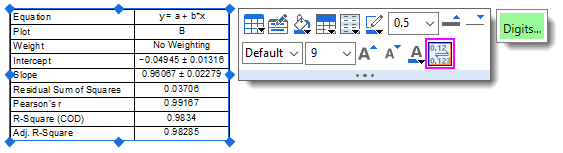
Linear and Polynomial Fit
Most curve fitting and peak finding analyses add an optional Result Table with equation, weighting, slope, intercept, etc., to the active graph. There is a Mini Toolbar button for adjusting displayed digits in the Result Table. |
Linear and polynomial fitting can be performed on worksheet data or data plots in a graph. Linear Fit of Matrix Stack is performed on a series of matrix objects.
| Tool Name | Menu Entry |
|---|---|
|
Analysis:Fitting:Linear Fit or Gadgets:Quick Fit (graph) |
|
Analysis:Fitting:Fit Linear with X Error |
|
Analysis:Fitting:Multiple Linear Regression |
|
Analysis:Fitting:Polynomial Fit or Gadgets:Quick Fit (graph) |
|
Analysis: Linear Fit of Matrix Stack (matrix) |
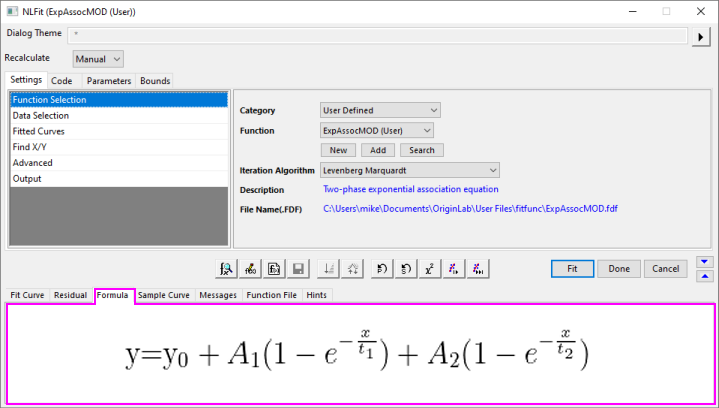
Nonlinear Curve Fit
You can perform nonlinear curve fitting using one of many built-in fitting functions, or you can create a user-defined fitting function. OriginPro supports implicit function fitting, surface fitting, and fit comparison. Some tools are available only in OriginPro.
The table below summarizes available nonlinear curve fitting tools:
| Tool Name | Features | Menu Entry |
|---|---|---|
|
|
Gadgets:Quick Fit (graph) or Gadgets:Quick Sigmoidal Fit (graph) |
|
|
Analysis:Fitting:Nonlinear Curve Fit (workbook, graph) |
|
|
Analysis:Fitting:Nonlinear Implicit Curve Fit (workbook, graph) |
|
|
Analysis:Fitting:Nonlinear Surface Fit (workbook, graph) or Analysis:Nonlinear Matrix Fit (matrix) |
|
|
Tools:Fitting Function Builder |
|
|
Tools:Fitting Function Organizer |
|
|
Click the Fitting Function Library icon in the Apps Gallery |
|
|
Analysis:Fitting:Simulate Curve or Analysis:Fitting:Simulate Surface |
|
|
Analysis:Fitting:Compare Datasets or Analysis:Fitting:Compare Models (workbook, graph) |
|
|
Analysis:Fitting:Rank Models (workbook, graph) |
User Defined fitting functions support an EMF or SVG image of the Formula (Equation) to display in lower panel of Nonlinear Curve Fitter (NLFit) or Fitting Function Organizer. To add an EMF or SVG image to your user-defined function:
|
Peak Analysis
Origin provides several tools for peak analysis. With these tools, you can define and subtract baselines, find peaks, integrate peaks, and fit peaks. Some tools are available only in OriginPro.
Note that a number of free Apps designed for peak analysis are available from the OriginLab File Exchange. To find and install these Apps click Analysis: Peaks and Baseline: Find Apps. The App Center will open, displaying only peak-fitting related Apps. Browse available Apps and click the Download and Install button ![]() to install an App.
to install an App.
The table below summarizes various built-in tools available for peak analysis:
| Tool Name | Features | Menu Entry |
|---|---|---|
|
|
Gadget:Quick Peaks (graph) |
|
|
Analysis:Peaks and Baseline:Multiple Peak Fit (graph, workbook) |
|
|
Analysis:Peaks and Baseline:Peak Analyzer (graph, workbook) |
|
|
Analysis:Peaks and Baseline:Batch Peak Analysis Using Theme (graph, workbook) |
Signal Processing
Origin provides signal processing tools for many tasks, including producing signal transforms, smoothing/filtering, and correlation on 1D and 2D signals. Advanced tools are available in OriginPro.
You may refer to the tables below for the signal processing tools and their menu entry.
Signal Transforms
| Tools | Menu Entry |
|---|---|
|
Gadgets:FFT... (graph) |
|
Analysis:Signal Processing:FFT (workbook, graph) |
|
Analysis:Signal Processing:FFT (matrix) |
|
Analysis:Signal Processing:STFT (workbook) |
|
Analysis:Signal Processing:Hilbert Transform (workbook, graph) |
|
Plot>2D:Profile:Image Profile (matrix, worksheet, XYZ data) |
Filtering
| Tools | Menu Entry |
|---|---|
|
Analysis:Signal Processing:FFT Filters (workbook, graph) |
|
Analysis:Signal Processing:2D FFT Filters (matrix) |
|
Analysis:Signal Processing:IIR Filter (workbook, graph) |
Smoothing
| Tools | Menu Entry |
|---|---|
|
Analysis:Signal Processing:Smooth (workbook, graph, matrix) |
Correlation
| Tools | Menu Entry |
|---|---|
|
Analysis:Signal Processing:Correlation (workbook, graph) |
|
Analysis:Signal Processing:2D Correlation (matrix) |
Convolution
| Tools | Menu Entry |
|---|---|
|
Analysis:Signal Processing:Convolution (workbook, graph) |
Wavelet Analysis (Pro Only)
| Tools | Menu Entry |
|---|---|
|
Analysis:Signal Processing:Wavelet Analysis (workbook, graph) |
|
Analysis:Signal Processing:Wavelet Analysis (matrix) |
Other Advanced Tools (Pro Only)
| Tools | Menu Entry |
|---|---|
|
Gadget:Rise Time (graph) |
|
Analysis:Signal Processing:Decimation (workbook, graph) |
|
Analysis:Signal Processing:Coherence (workbook, graph) |
|
Analysis:Signal Processing:Envelope (workbook, graph) |
Image Processing
Origin provides a collection of tools for basic image processing. These tools are accessible from the Image menu when a matrixbook is active. Some tools are ![]() only.
only.
The tools are organized in the following sub-menus:
- Image:Adjustments
- Image:Arithmetic Transforms
- Image:Conversion
- Image:Geometric Transforms
- Image:Spatial Filters
Topics for Further Reading
- Analysis Dialog Boxes: Specifying Your Input Data
- Outputting Analysis Results
- Recalculation of Analysis Results
- Generating Analysis Report Sheets
- Performing Math Operations on Datasets
- Linear/Polynomial Regression
- Nonlinear Curve Fitting
- Peak Analysis using Origin
- Signal Processing
- Image Processing and Analysis