6.2.2 User-Defined Arbitrary Tick Positions
UserDef-TickPosition
Summary
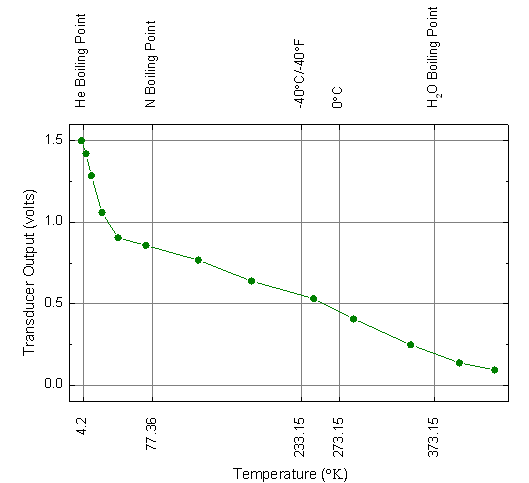
This graph will show you how to specify tick locations using a dataset and show customized tick labels at those locations.
Minimum Origin Version Required: Origin 2015 SR0
What you will learn
- How to specify the tick location using dataset
- How to show the customized tick labels
Steps
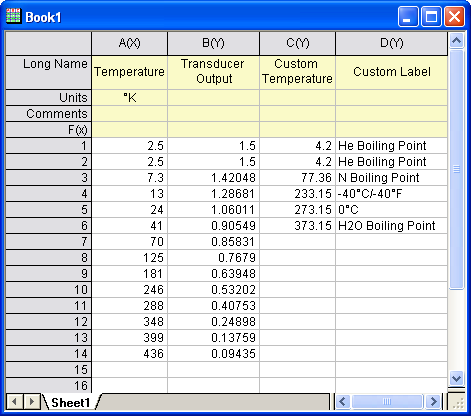
- Copy the sample data, and paste it into row 1 of column A in Origin worksheet. Set the first row as Long Name and the second row as Units.
- Highlight columns A and B. Select Plot > Basic 2D :Line + Symbol from the main menu. Alternatively, you can simply click the Line + Symbol button on the 2D Graphs toolbar.
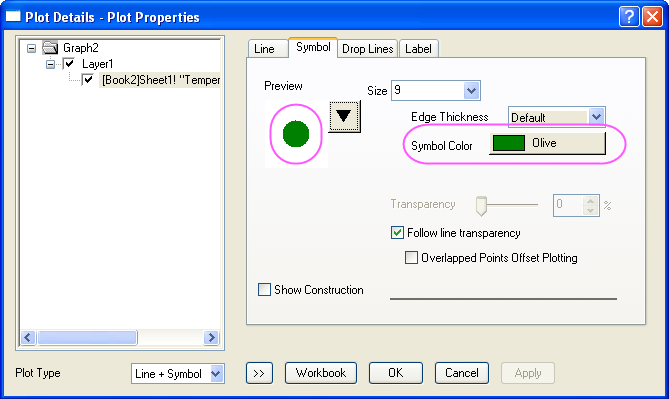
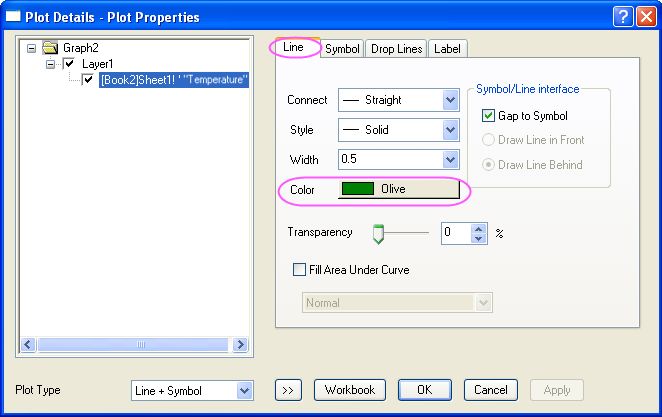
- Double-click the graph to open the Plot Details dialog. On the Symbol tab, change the symbol to a solid circle, and the color to Olive. On the Line tab, change the line color to Olive and click OK to close the dialog and apply the changes.
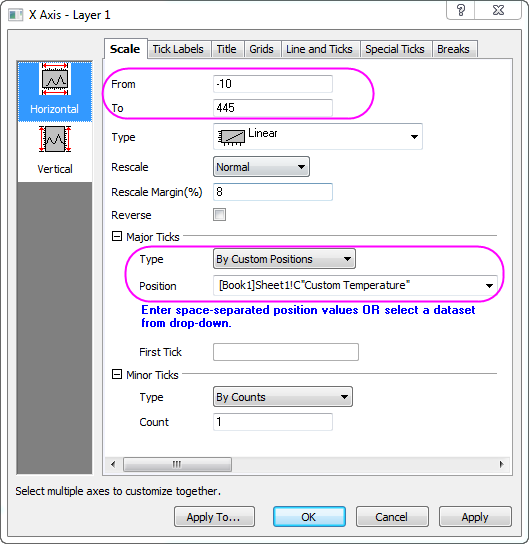
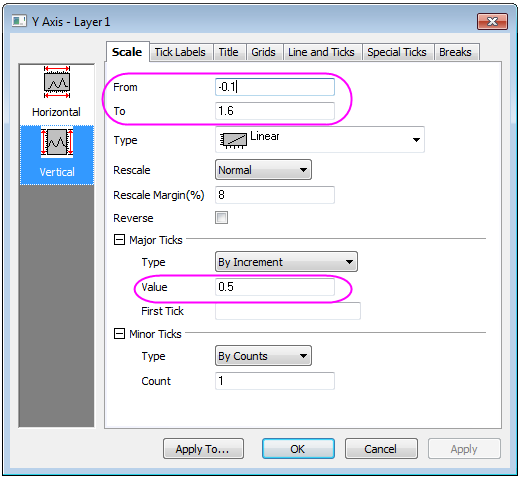
- Double-click the X axis to open the Axis dialog. For both Horizontal and Vertical icon in Scale tab, enter these settings for the X and Y axes:
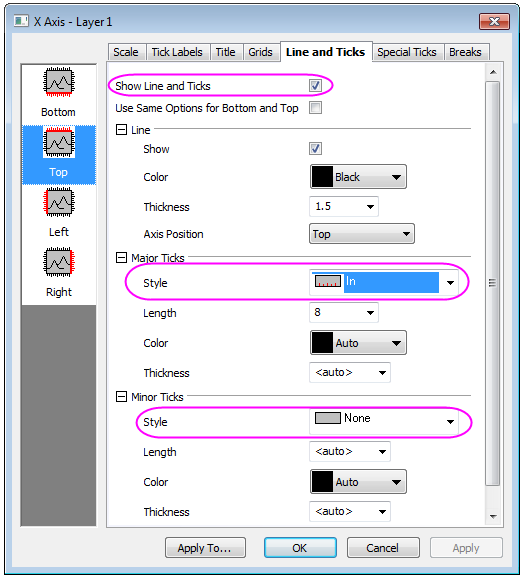
- On Line and Ticks tab, go to Top and Right page, and check on Show to show the axis on top (right), Set the ticks style follows the graph below:
- Then, click the Apply To... button and go to the Apply to Others dialog, set the following:
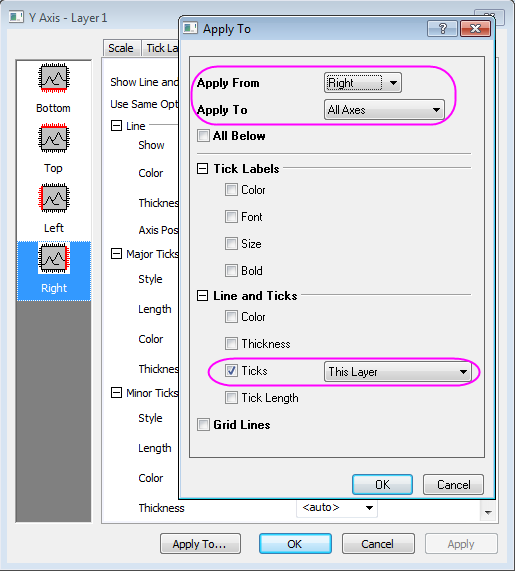
- Click OK to close the Apply to Others dialog and return to the Axis dialog.
- Go to Display tab in Tick Labels tab, and set the ticks Labels for bottom follows the graph below. In addation, you need to rotate the tick labels by 90 degree in Format tab for both top and bottom (which can be done in Bottom page) axis.
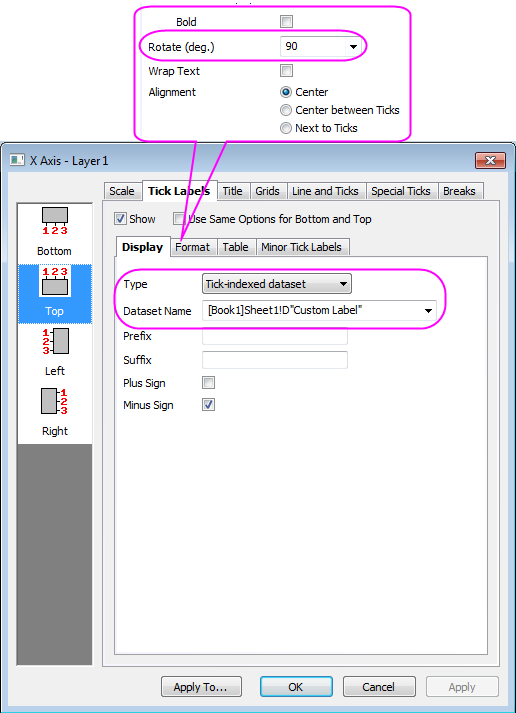
- On the Bottom page under Tick Labels of X Axis, set the Rotate(deg.) to 90 similarly.
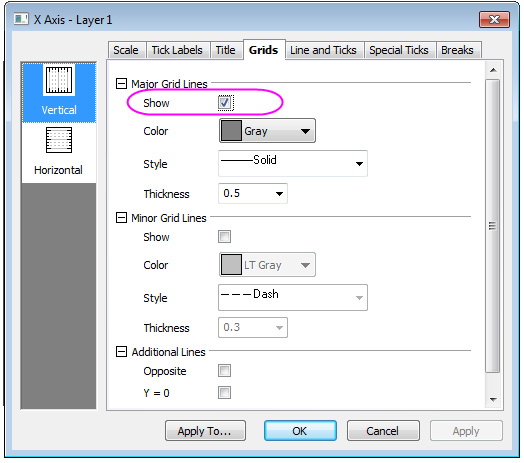
- Select the Grids tab in Axis dialog axis. Check on Show in Major Grid Lines group for both Vertical and Horizontal:
- Click OK to close the Axis dialog. Adjust the Layer Area in Format: Layer: Size/ Speed tab. Your final graph should look like this:
Sample Data
| Temperature
|
Transducer Output
|
Custom Temperature
|
Custom Label
|
| °K
|
volts
|
|
|
| 2.5
|
1.5
|
4.2
|
He Boiling Point
|
| 2.5
|
1.5
|
4.2
|
He Boiling Point
|
| 7.3
|
1.42048
|
77.36
|
N Boiling Point
|
| 13
|
1.28681
|
233.15
|
-40°C/-40°F
|
| 24
|
1.06011
|
273.15
|
0°C
|
| 41
|
0.90549
|
373.15
|
H2O Boiling Point
|
| 70
|
0.85831
|
|
|
| 125
|
0.7679
|
|
|
| 181
|
0.63948
|
|
|
| 246
|
0.53202
|
|
|
| 288
|
0.40753
|
|
|
| 348
|
0.24898
|
|
|
| 399
|
0.13759
|
|
|
| 436
|
0.09435
|
|
|