5.5.16.2.5.3 Tutorial of Taguchi Design
Contents
Static Taguchi Design
An engineering team is working on optimizing the process of producing biodiesel from waste cooking oil. Their goal is to maximize biodiesel Yield. They identified three factors that impact biodiesel production:
- Catalyst Type: Sodium hydroxide (NaOH) and Potassium hydroxide (KOH)
- Reaction Temperature: 60°C and 75°C
- Solvent Type: Methanol and Ethanol
They also identified Humidity as a Noise factor that impacts Yield. Therefore, the experiment will be done at three humidity levels: low, medium, and high.
Create Design
- Select menu Statistics: Quality Improvement: Design of Experiment
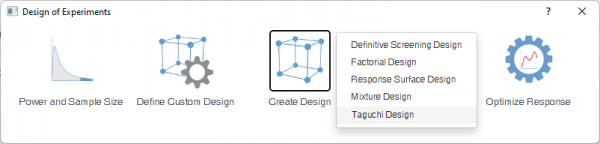
- Click Create Design button and select Taguchi Design.
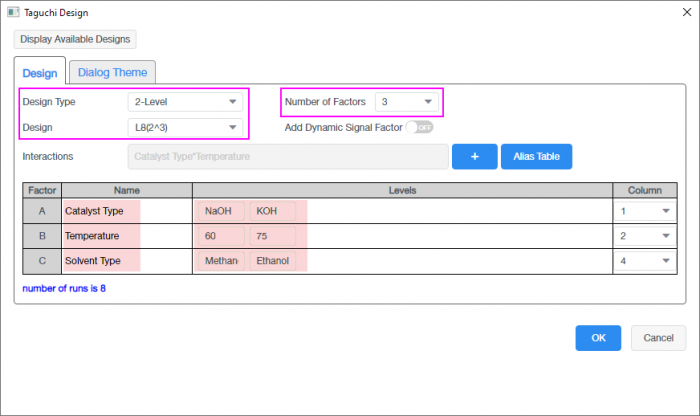
- We have 3 factors and the levels are 2, and select L8(2^3) for Design. In the opened dialog, fill in the table as below.
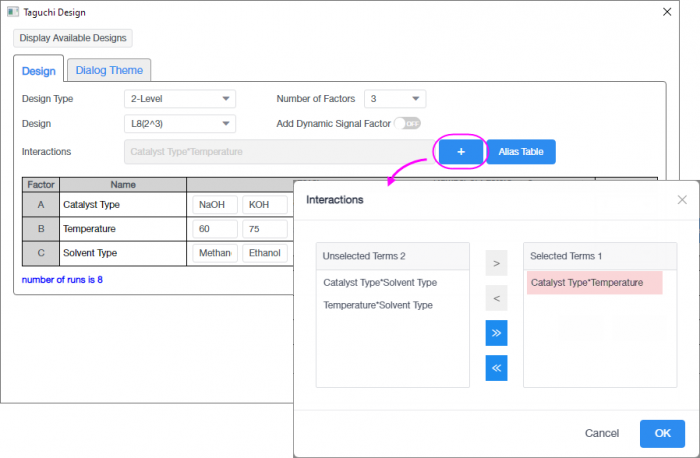
- Click on the + sign next to interaction and add Catalyst Type*Temperature to Selected Term
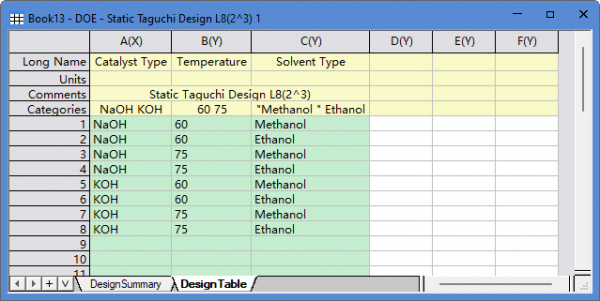
- Click OK to generate the design table
Analyze Design
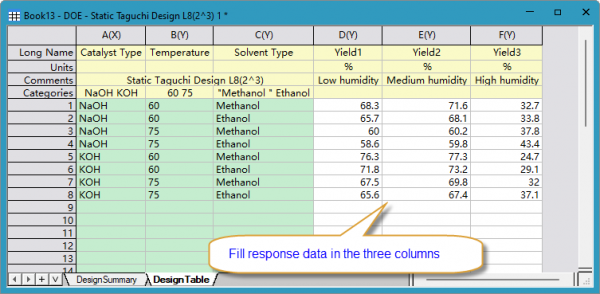
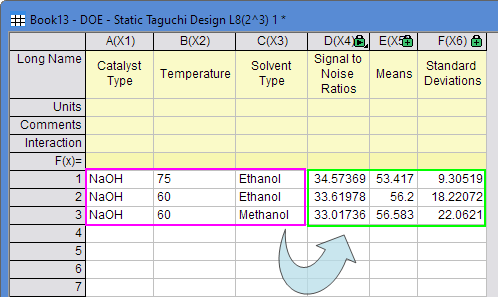
- In the DesignTable, enter response data under columns D, E, and F for the three humidity levels (Yield1, Yield2, Yield3)
-
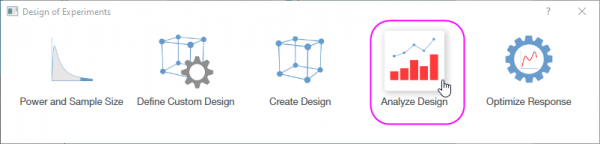
- Click Analyze Design button.
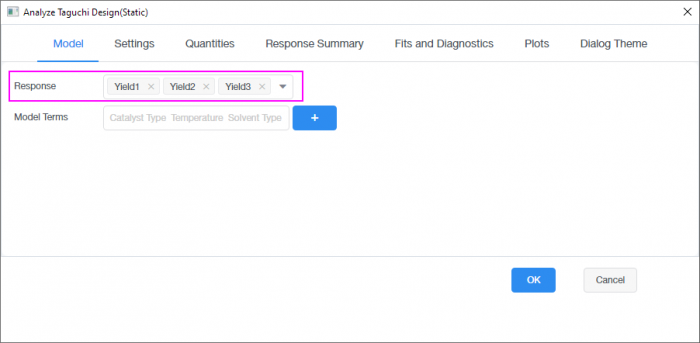
- Add Yield1, Yield2, Yield3 to Response in the dialog.
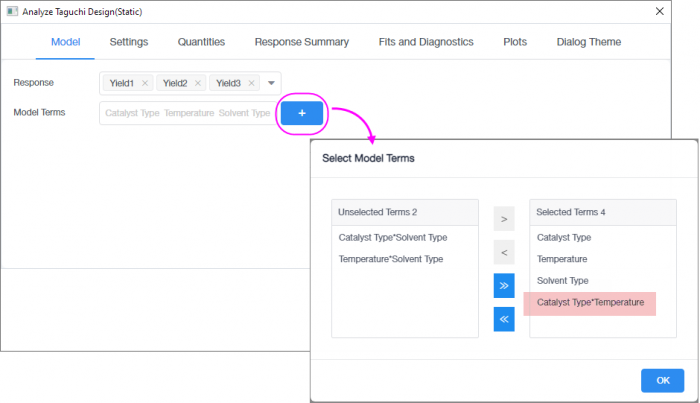
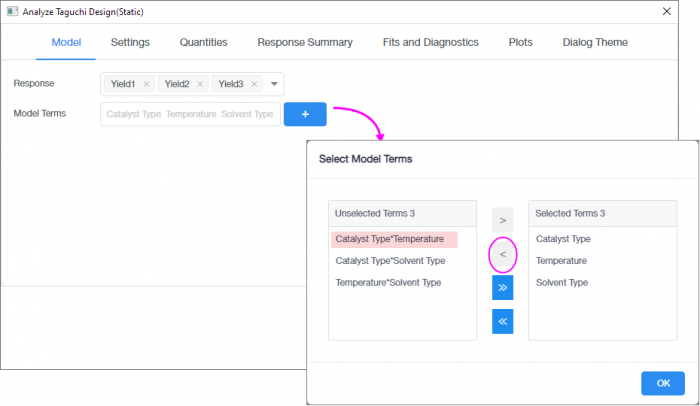
- Click the + sign next to Model Terms. The interaction is already included under Selected Terms since it was prespecified under Create Design.
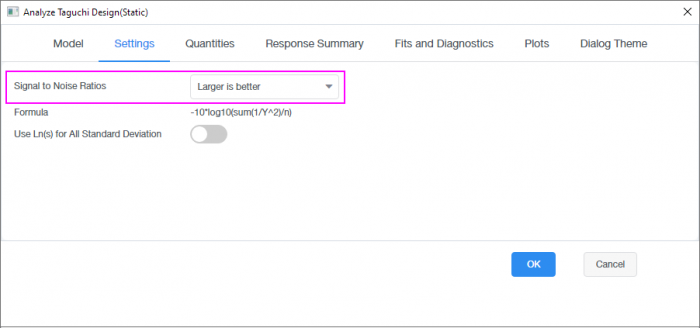
- Go to Settings tab and select Larger is better in the Signal to Noise Ratios since we are looking to maximize Yield.
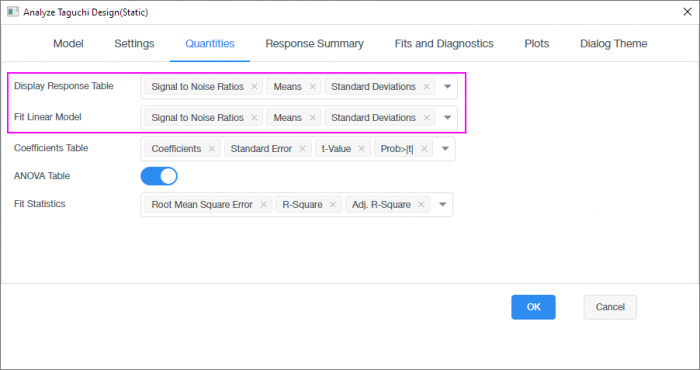
- Go to Quantities tab and select all options.
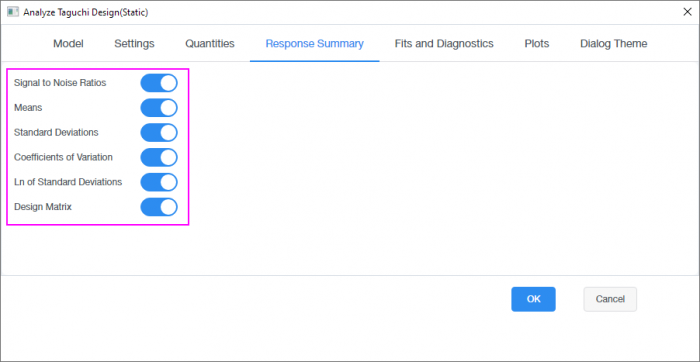
- Go to Response Summary tab and select all options too.
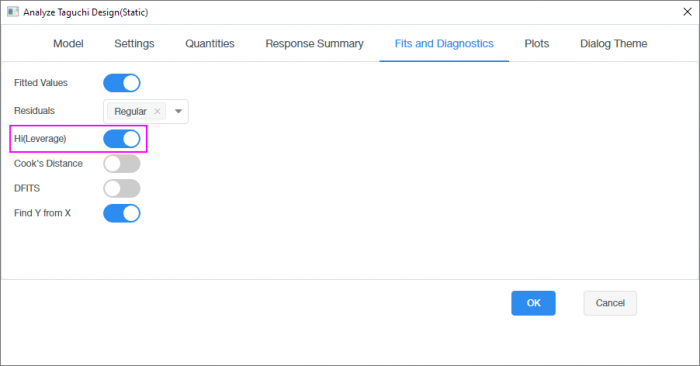
- Go to Fits and Diagnostics tab and select Hi(Leverage)
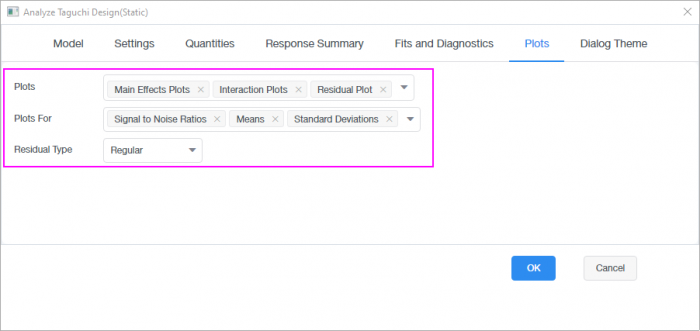
- Go to Plots tab and select All. Keep Residual Type is Regular. Click OK
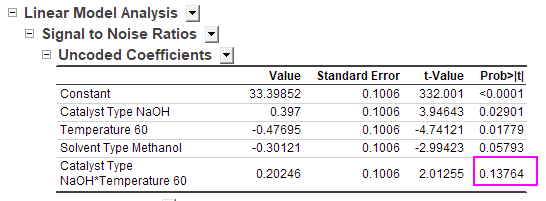
- In the DOEAnalysis result sheet, under the node Linear Model Analysis, you will find the Signal to Noise Ratios, Means and Standard Deviations tables show that the interaction term is not significant.
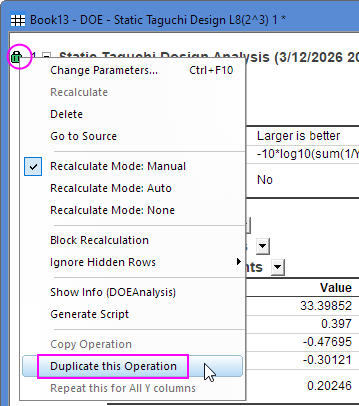
- Let's rerun the analysis by removing the interaction term. Click on the Green Lock and select Duplicate this Operation. In the duplicated result DOEAnalysis1 sheet, click on the Green Lock and Change Parameters.
- In the Model tab, click the + of Model Terms and remove the Catalyst Type*Temperature interaction.
Click OK
- In the result sheet, the Signal to Noise Ratios is used to identify the optimal factor settings that maximize Yield while minimizing variability. The Mean represents the average Yield across different factor settings, while the Standard Deviation indicates how consistent and stable the process is.
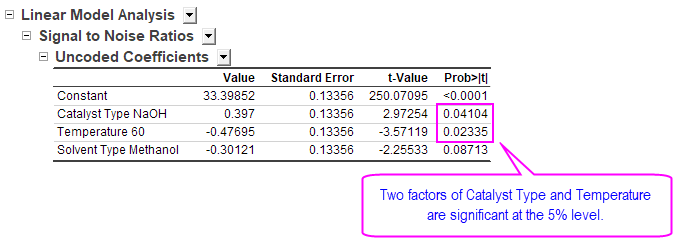
- Let's look at the Signal to Noise ratios under Linear Model Analysis. We can see that two factors, Catalyst Type and Temperature, are significant at the 5% level. This means that different levels of Catalyst Type and Temperature will provide different values of Yield.
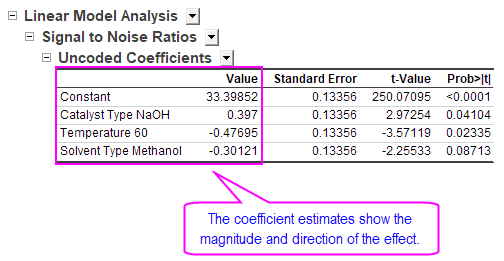
The coefficient estimates show the magnitude and direction of the effect. - In the Response Tables, the goal is to maximize the Signal to Noise ratios and Means, while minimizing the Standard Deviation. Let's look at the Signal to Noise ratios under the Response Table.
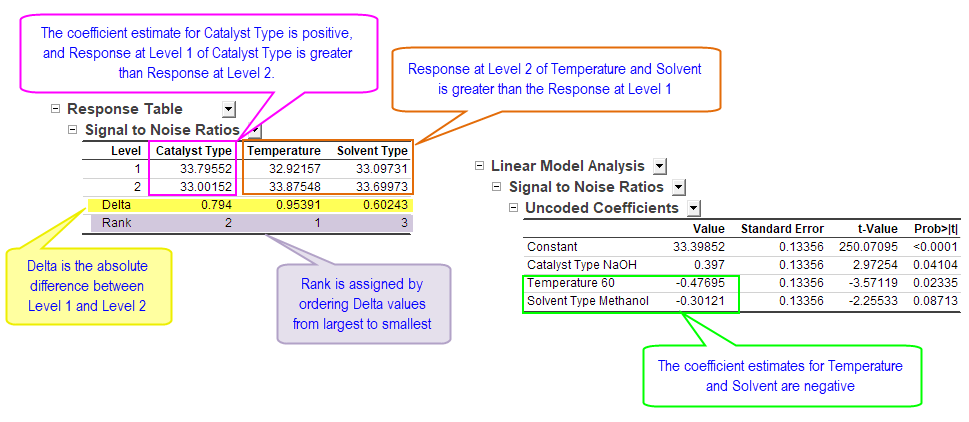
These are the average Responses for each factor across 2 different levels. The coefficient estimate for Catalyst Type is positive, and Response at Level 1 of Catalyst Type is greater than Response at Level 2. The coefficient estimates for Temperature and Solvent are negative, and Response at Level 2 of Temperature and Solvent is greater than the Response at Level 1. Delta is the absolute difference between Level 1 and Level 2, and rank is assigned by ordering Delta values from largest to smallest. Signal to Noise ratios are maximized under the following settings: Catalyst Type is NaOH, Temperature is 75, and Solvent is Ethanol.
-
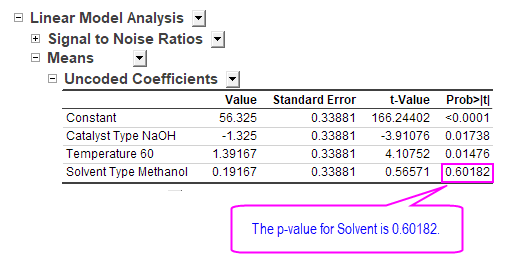
Similar inferences can also be made for Means and the Standard Deviation. Let's look at the Means table under Linear Model Analysis. The p-value for Solvent is 0.60182.
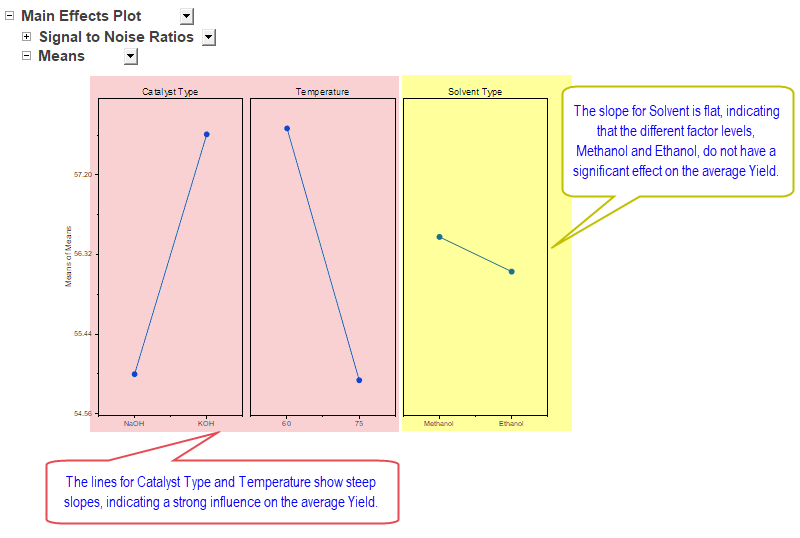
- Go to the Main Effects Plots for Means. The lines for Catalyst Type and Temperature show steep slopes, indicating a strong influence on the average Yield.
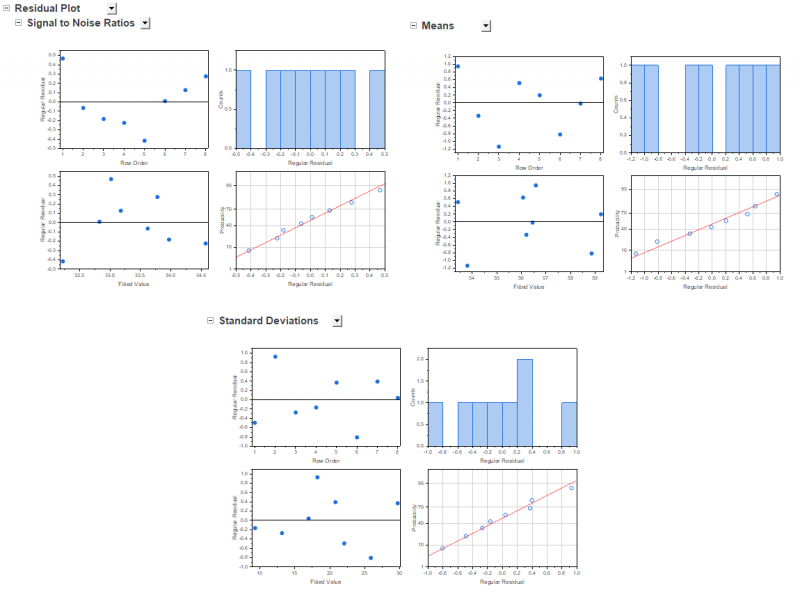
The slope for Solvent is flat, indicating that the different factor levels, Methanol and Ethanol, do not have a significant effect on the average Yield. - Go to the Residual Plots for the three measures. The residual plots do not show any patterns.
- Let's look at the Signal to Noise ratios under Linear Model Analysis. We can see that two factors, Catalyst Type and Temperature, are significant at the 5% level. This means that different levels of Catalyst Type and Temperature will provide different values of Yield.
- The next step is to determine fitted values for the three characteristics, Signal to Noise ratios, Means, and Standard Deviation.
Click on DOEFindYfromX1 sheet. Enter different levels for the three factors, Catalyst Type, Temperature, and Solvent and values for the three characteristics will automatically populate.
Dynamic Taguchi Design
An engineering team is interested in reducing Image Blur for photos taken by a drone. They identified three control factors that impact Image Blur:
- Gimbal stiffness: Low and High
- Damping algorithm: Light filtering and Aggressive filtering
- Shutter speed: Fast and Slow
They also identified a Signal Factor, Drone Speed, which varies over three levels, 2, 4, and 6 meters per second.
Create Design
- Select menu Statistics: Quality Improvement: Design of Experiment
- Click Create Design button and select Taguchi Design.
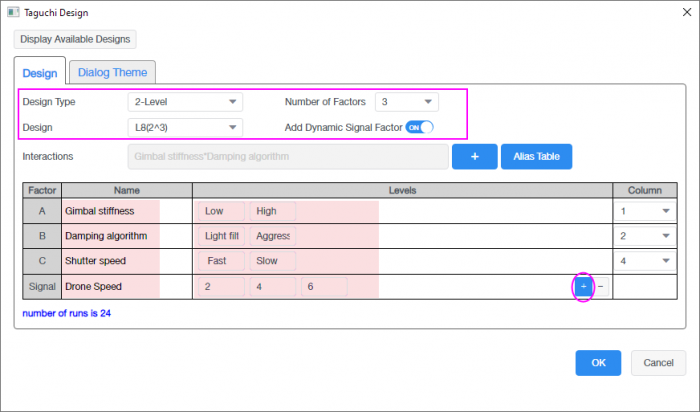
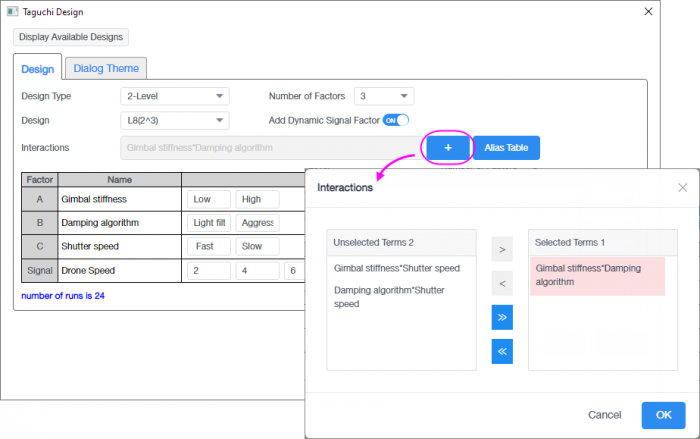
- We have 3 factors and the levels are 2, and select L8(2^3) for Design. And turn on Add Dynamic Signal Factor option. Click the + sign next to Signal to add one.
- In the opened dialog, fill in the table as below.
- Click on the + sign next to interaction and add Gimbal stiffness * Damping algorithm to Selected Term
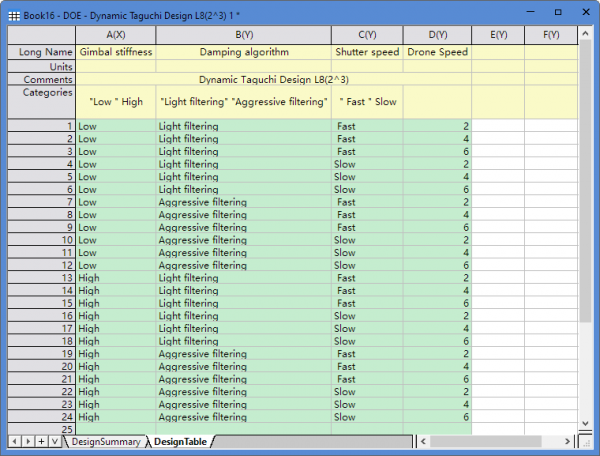
- Click OK to generate the design table.
Analyze Design
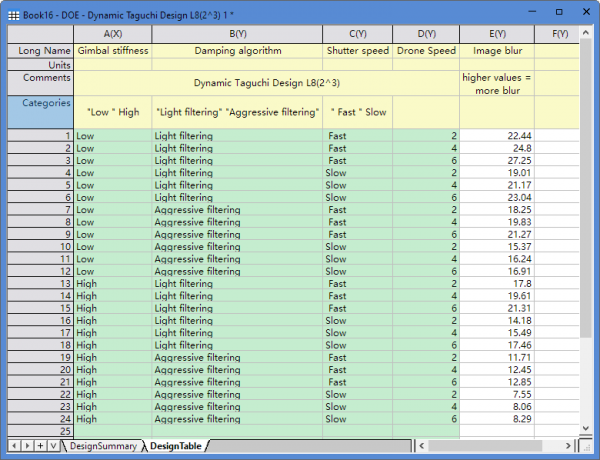
- In the DesignTable, enter Image Blur values in column E.
-
- Click Analyze Design button.
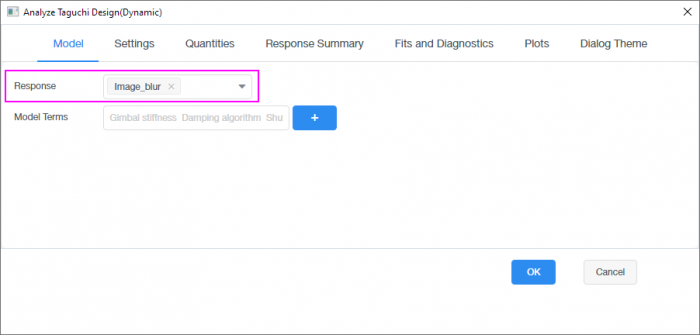
- Add Image_blur to Response in the dialog.
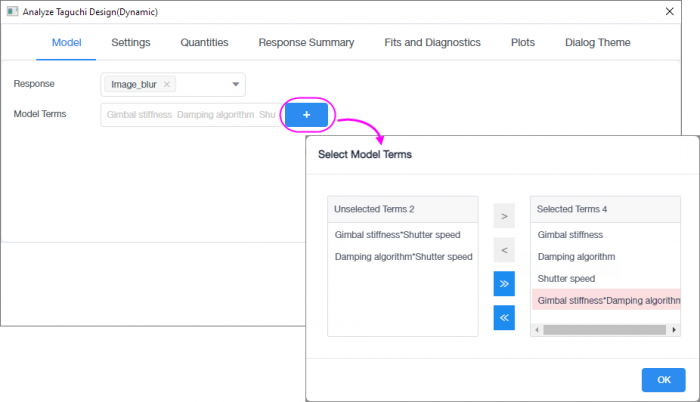
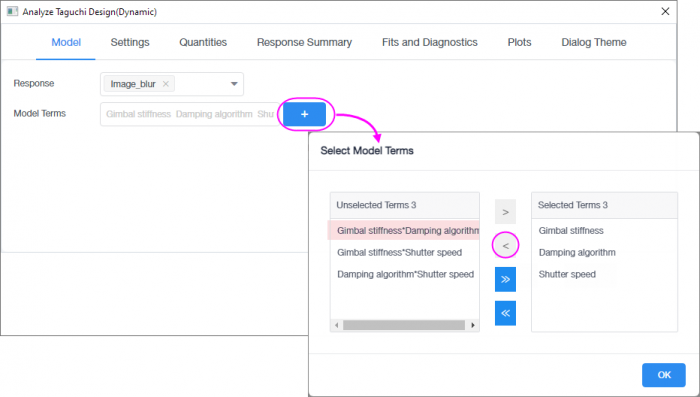
- Click the + sign next to Model Terms. The interaction is already included under Selected Terms since it was prespecified under Create Design.
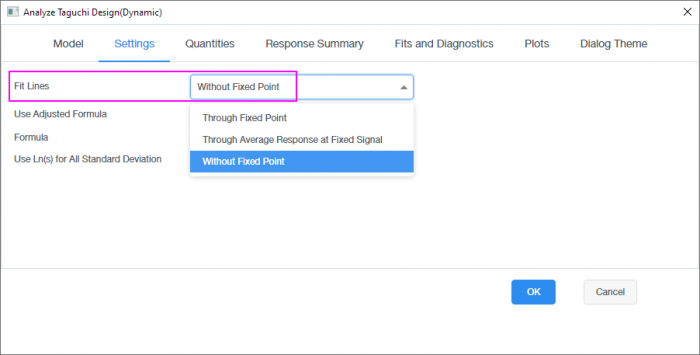
- Go to Settings tab. In a Dynamic Taguchi design, the goal is to optimize the Signal to Response relationship by fitting an appropriate model:
- Through Fixed Point. This option is not recommended for this analysis, since it forces the fit through a predefined Signal and Response value. The default values for Signal and Response are zero, but this should not be used since Image Blur can still be present even when the drone is stationary.
- Through Average Response at Fixed Signal. This anchors the average observed Response at a chosen Signal Level. One option is to anchor the fit at a Signal Factor of 4, which represents the average drone speed. This option will limit the range of the Response variable, Image Blur.
- Without Fixed Point. This is the most flexible and preferred option. Both intercept and slope are estimated freely. This option is suitable for processes that have a nonzero Response at zero, or when there is no clear anchor point.
We’ll select Without a Fixed Point. - Go to Quantities tab and select all options.
- Go to Response Summary tab and select all options.
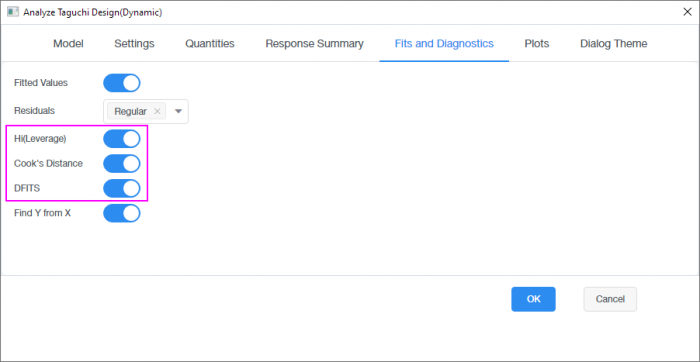
- Go to Fits and Diagnostics tab and select all options.
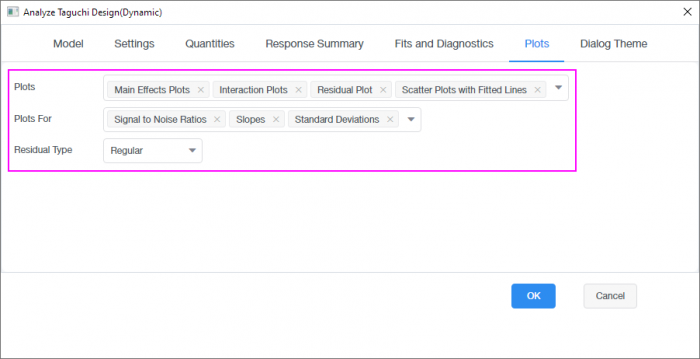
- Go to Plots tab and select All. Keep Residual Type is Regular. Click OK
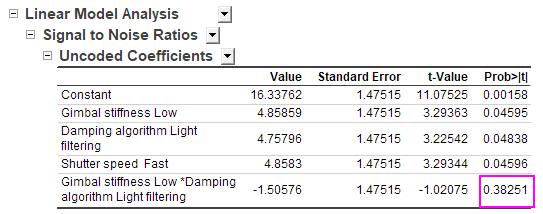
- In the DOEAnalysis result shee, under the node Linear Model Analysis, the Signal to Noise Ratios, Means, and Standard Deviations tables show that the interaction term is not significant.
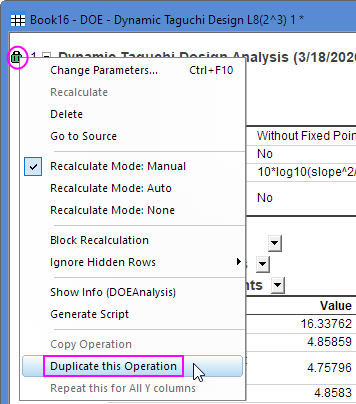
- Let's rerun the analysis by removing the interaction term. Click on the Green Lock and select Duplicate this Operation. In the duplicated result DOEAnalysis1 sheet, click on the Green Lock and Change Parameters.
- In the Model tab, click the + of Model Terms and remove the Gimbal stiffness*Damping algorithm interaction.
Click OK
- In a Dynamic Taguchi Design, the characteristic, Slope, measures the rate of change in the Response variable relative to the Signal Factor level.
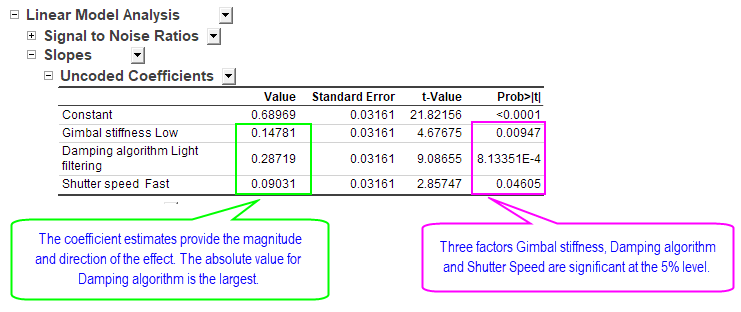
- Let's look at Slope under Linear Model Analysis. We can see that all three factors: Gimbal stiffness, Damping algorithm and Shutter Speed are significant at the 5% level. The coefficient estimates provide the magnitude and direction of the effect. The absolute value for Damping algorithm is the largest.
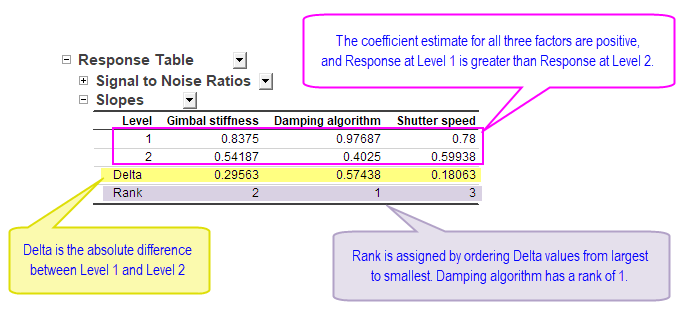
- Let's look at Slope under Response Table. These are the average Responses for each factor across 2 different levels. The coefficient estimate for all three factors are positive, and Response at Level 1 is greater than Response at Level 2. Delta is the absolute difference between Level 1 and Level 2, and rank is assigned by ordering Delta values from largest to smallest. Damping algorithm has a rank of 1.
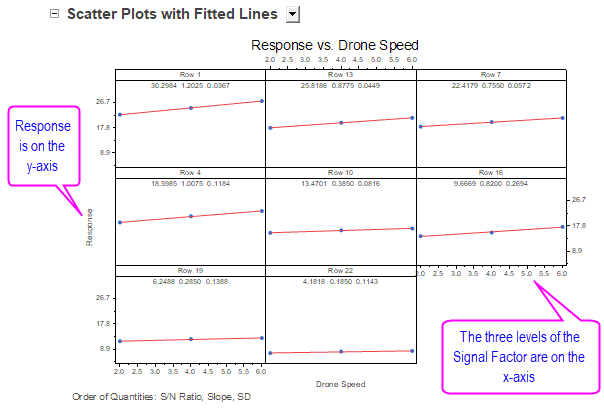
Ideally, we would target slope to be zero. There should be no relationship between drone speed and Image Blur. Slope is closest to zero under the following factor levels: Gimbal stiffness is High, Damping algorithm is Aggressive filtering, and Shutter speed is Slow. Keep in mind that these settings come at the cost of a lower Signal to Noise ratio and higher Standard Deviation. - Go to Scatter Plots with Fitted Lines. The scatterplots are arranged in decreasing order of Signal to Noise ratio. Response is on the y-axis, and the three levels of the Signal Factor are on the x-axis. Ideally, the fitted line should pass closely through the blue points.
- Let's look at Slope under Linear Model Analysis. We can see that all three factors: Gimbal stiffness, Damping algorithm and Shutter Speed are significant at the 5% level. The coefficient estimates provide the magnitude and direction of the effect. The absolute value for Damping algorithm is the largest.