Tutorial zum Identifizieren der Datenverteilung
Inhalt
Starthinweise
- Laden Sie die Datei des Beispielprojekts hier herunter und öffnen Sie sie in Origin.
- Starten Sie dieses Tutorial mit der installierten App Statistical Process Control. Wenn Sie die App nicht installiert haben, siehe Apps für Origin, um die App zu finden und zu installieren.
Weiterführende Themen: |
Anwenderbericht
Ein Bauherr verfügt über Hausverkaufsdaten aus der Umgebung. Er möchte die Datenverteilung mit der besten Anpassung für die Folgeanalysen ermitteln.
Datenverteilung identifizieren
- Öffnen Sie die Beispielprojektdatei in Origin und gehen Sie zum Ordner 3. Nonnormal mit Hilfe des Projekt Explorers. Aktivieren Sie die Arbeitsmappe House Sold.
- Markieren Sie Spalte B im Arbeitsblatt. Klicken Sie auf das Symbol Statistical Process Control
 im Fenster der Apps-Galerie.
 - Wählen Sie die Registerkarte Datenverteilung identifizieren und klicken Sie auf das Symbol Datenverteilung identifizieren, um den Dialog zu öffnen.
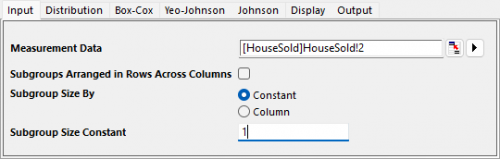
- Auf der Registerkarte Eingabe des geöffneten Dialogs wird Spalte B automatisch als Messdaten ausgewählt. Wählen Sie für Teilgruppengröße nach die Option Konstant und setzen Sie die Teilgruppengrößenkonstante auf 1.
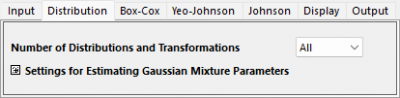
- Behalten Sie auf der Registerkarte Eingabe für die Anzahl der Verteilungen und Transformationen die Option Alle bei.
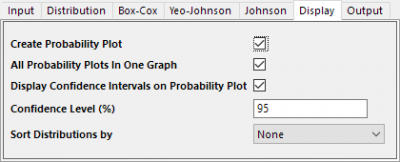
- Aktivieren Sie auf der Registerkarte Anzeige die Option Wahrscheinlichkeitsdiagramm erstellen.
- Klicken Sie auf OK. Das Berichtsblatt wird erstellt.
Ergebnisse interpretieren
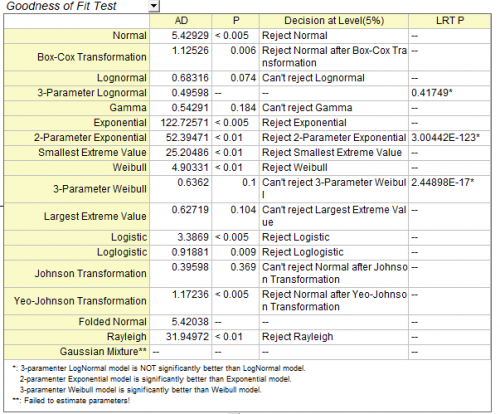
Wir können basierend auf folgenden Ergebnissen ein Anpassungsmodell vergleichen und auswählen:
Das Folgen der Verteilungen ist eine gute Anpassung der Daten. Ihre p-Werte sind größer als 0,05 in der Tabelle Test der Anpassungsgüte. Die Punkte des Wahrscheinlichkeitsdiagramms folgen einer geraden Linie innerhalb der Konfidenzgrenzen.
- Johnson-Transformation (0,369)
- Gamma (0,184)
- Größter Extremwert (0,104)
- Weibull mit 3 Parametern (0,1)
- Lognormal (0,074)
Wahrscheinlichkeitsdiagramm (P-P-Diagramm)
Je näher die Punkte bei der Referenzlinie liegen, desto besser eignet sich die Verteilung für den Datensatz.
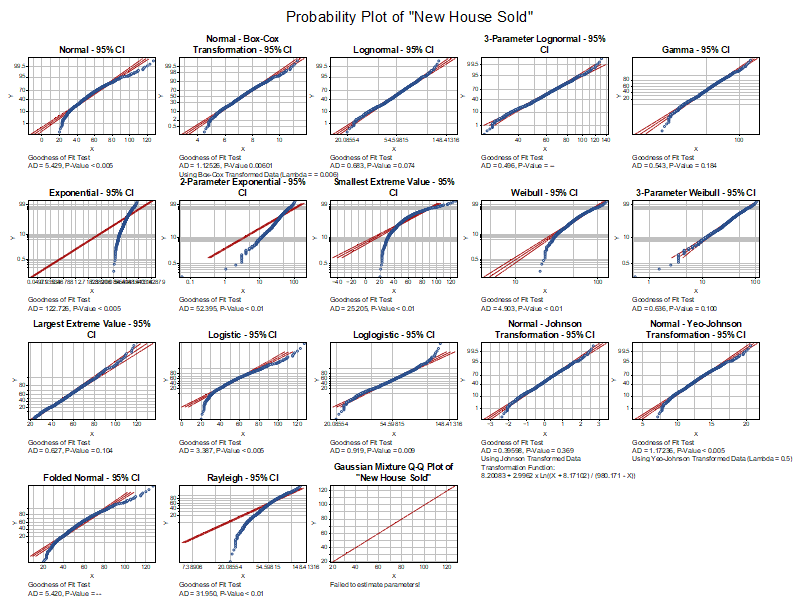
Tabelle Test der Anpassungsgüte